City of Toronto Procurement: Who Buys, Who Wins, and Where the $6.44B Goes
ARTICLE SUMMARY
The City of Toronto awarded $6.44 billion in tracked contracts from 2021 through 2025: 1,427 contracts to 793 vendors, based on the city's awarded contracts open data .
- For
- Vendors, buyers, and readers following Canadian procurement
- Main topic
- Market Maps
- Why it matters
- The article's argument is summarized up front so people and agents can grasp the point before reading the full body.
The City of Toronto awarded $6.44 billion in tracked contracts from 2021 through 2025: 1,427 contracts to 793 vendors, based on the city's awarded contracts open data. The market bottomed out at $559.2 million in 2022 and reached $2.31 billion in 2025, more than four times the 2022 level. Construction and infrastructure take 64.7 percent of the money, Ontario vendors win 69.6 percent, and repeat vendors win 81.4 percent. This page maps who buys, who wins, and how the work is tendered.
How big is the City of Toronto procurement market?
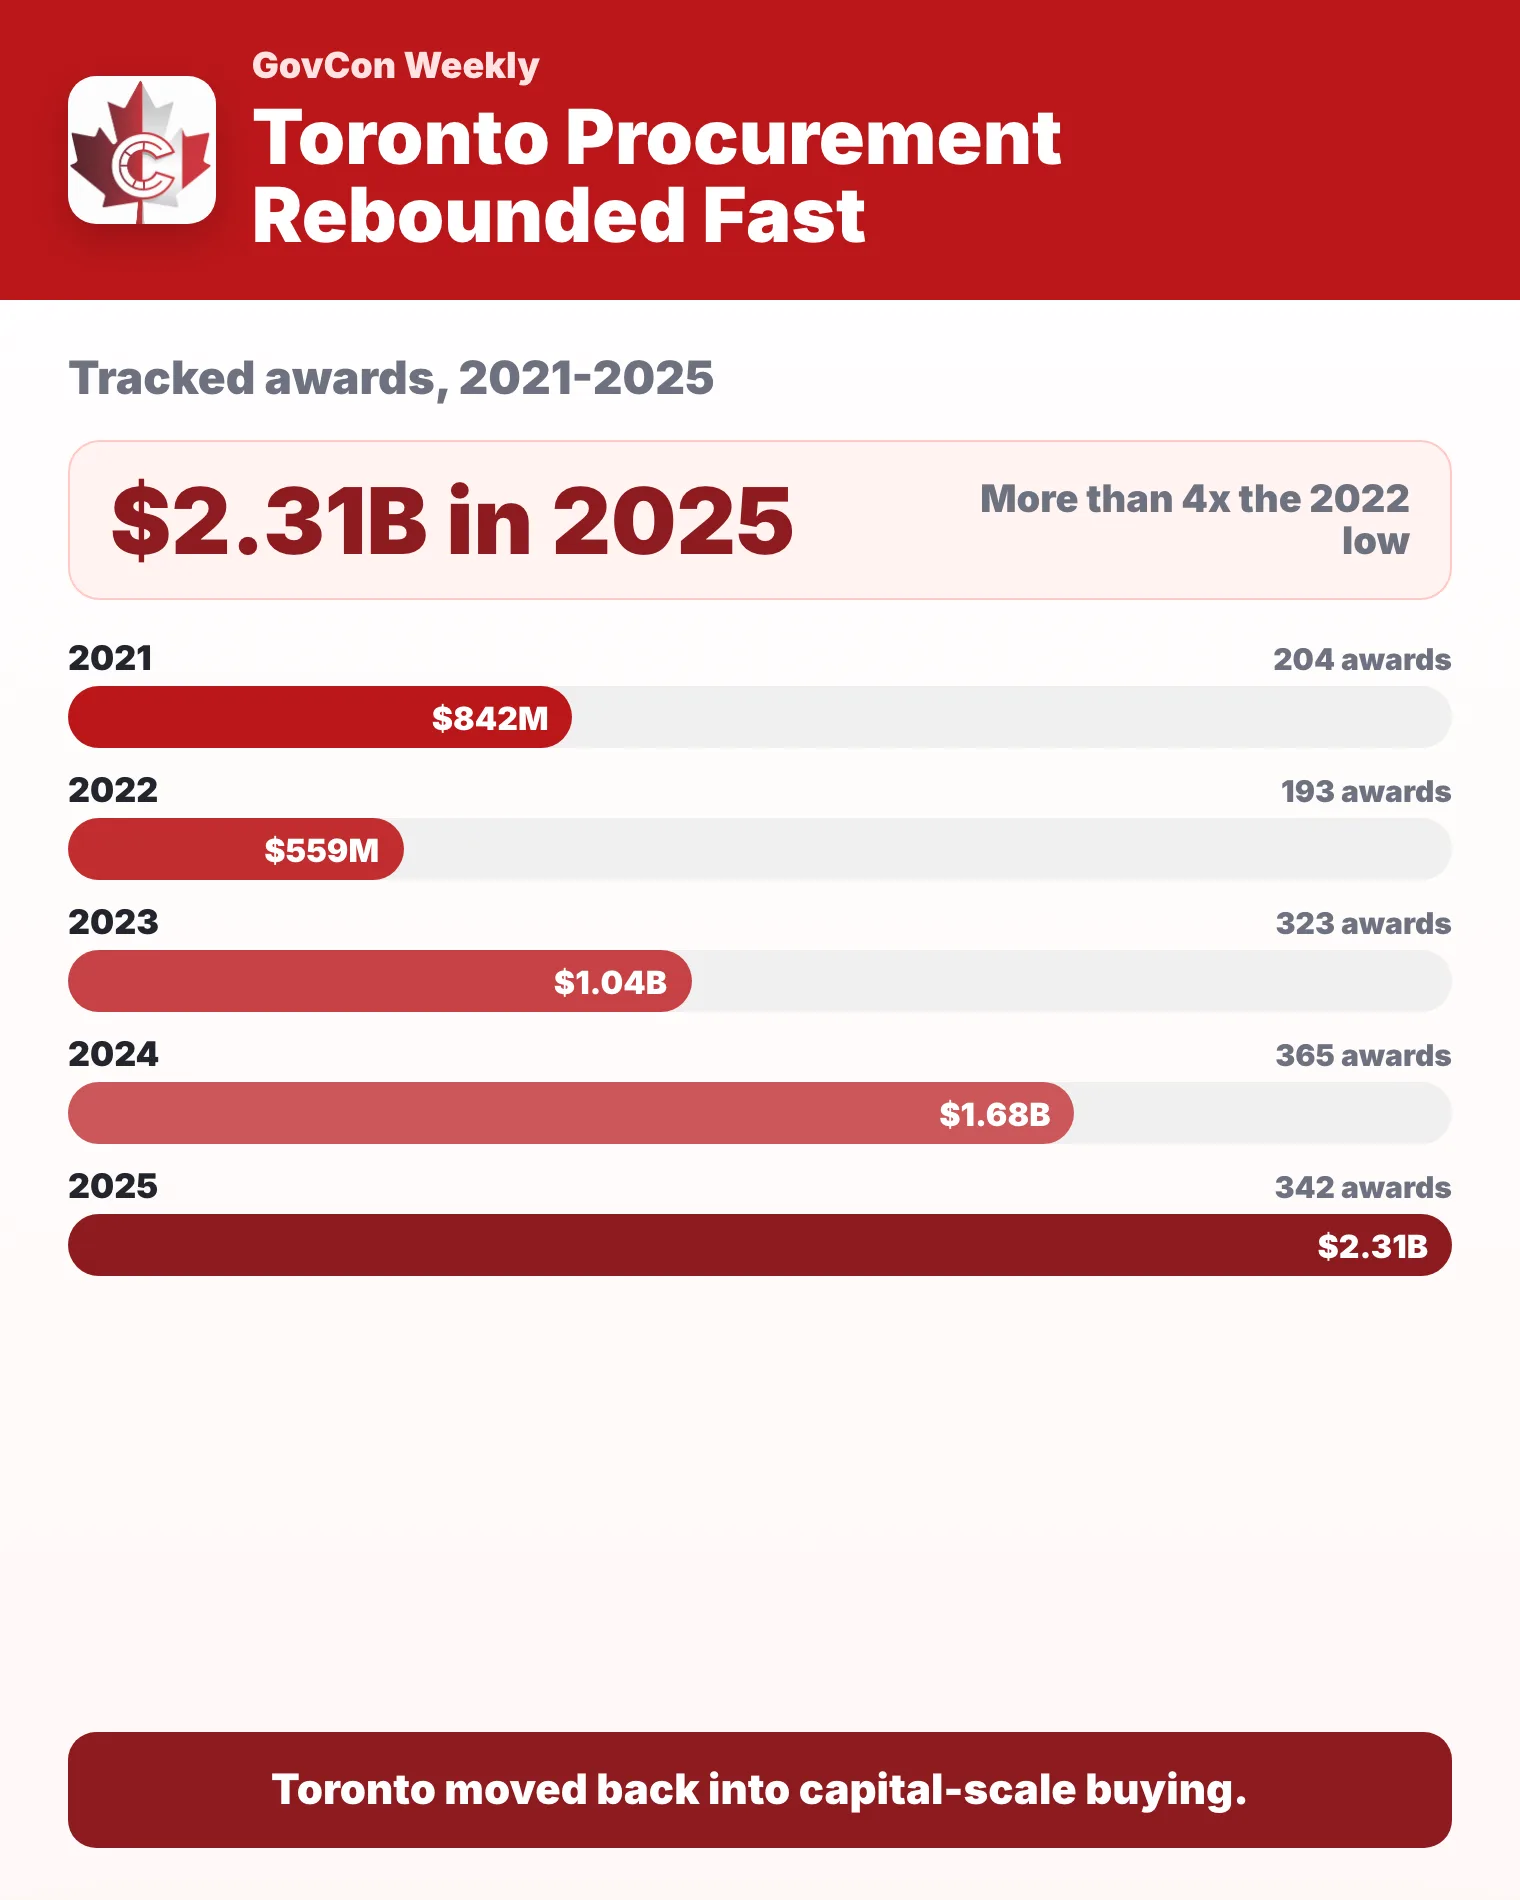
Across the five complete years from 2021 to 2025, tracked City of Toronto awards total $6.44 billion. The shape is a COVID-era trough followed by a fast recovery: awards fell to $559.2 million in 2022, rose in both 2023 and 2024, then jumped to $2.31 billion in 2025, the largest full year in the window (GovCon Weekly analysis).
| Year | Award value | Contracts | Share of five-year value |
|---|---|---|---|
| 2021 | $842.2M | 204 | 13.1% |
| 2022 | $559.2M | 193 | 8.7% |
| 2023 | $1.04B | 323 | 16.2% |
| 2024 | $1.68B | 365 | 26.1% |
| 2025 | $2.31B | 342 | 35.9% |
| Total | $6.44B | 1,427 | 100.0% |
Source: City of Toronto awarded contracts open data, 2021 to 2025, classified and analysed by Publicus.
The number of contracts did not rise in proportion to the dollars. 2025 had fewer contracts than 2024 and far more value, so the rebound is larger awards, not just more activity. The average tracked award across the window is $4.5 million, and in 2025 a handful of big infrastructure, water, waste, parks and real estate awards moved the whole market (City of Toronto buyer profile).
For contractors, the opportunity is not spread evenly across years. Firms that sell into capital renewal, water, construction, environmental services, parks or facility work are dealing with a market that has regained its momentum.
What does the City of Toronto buy?
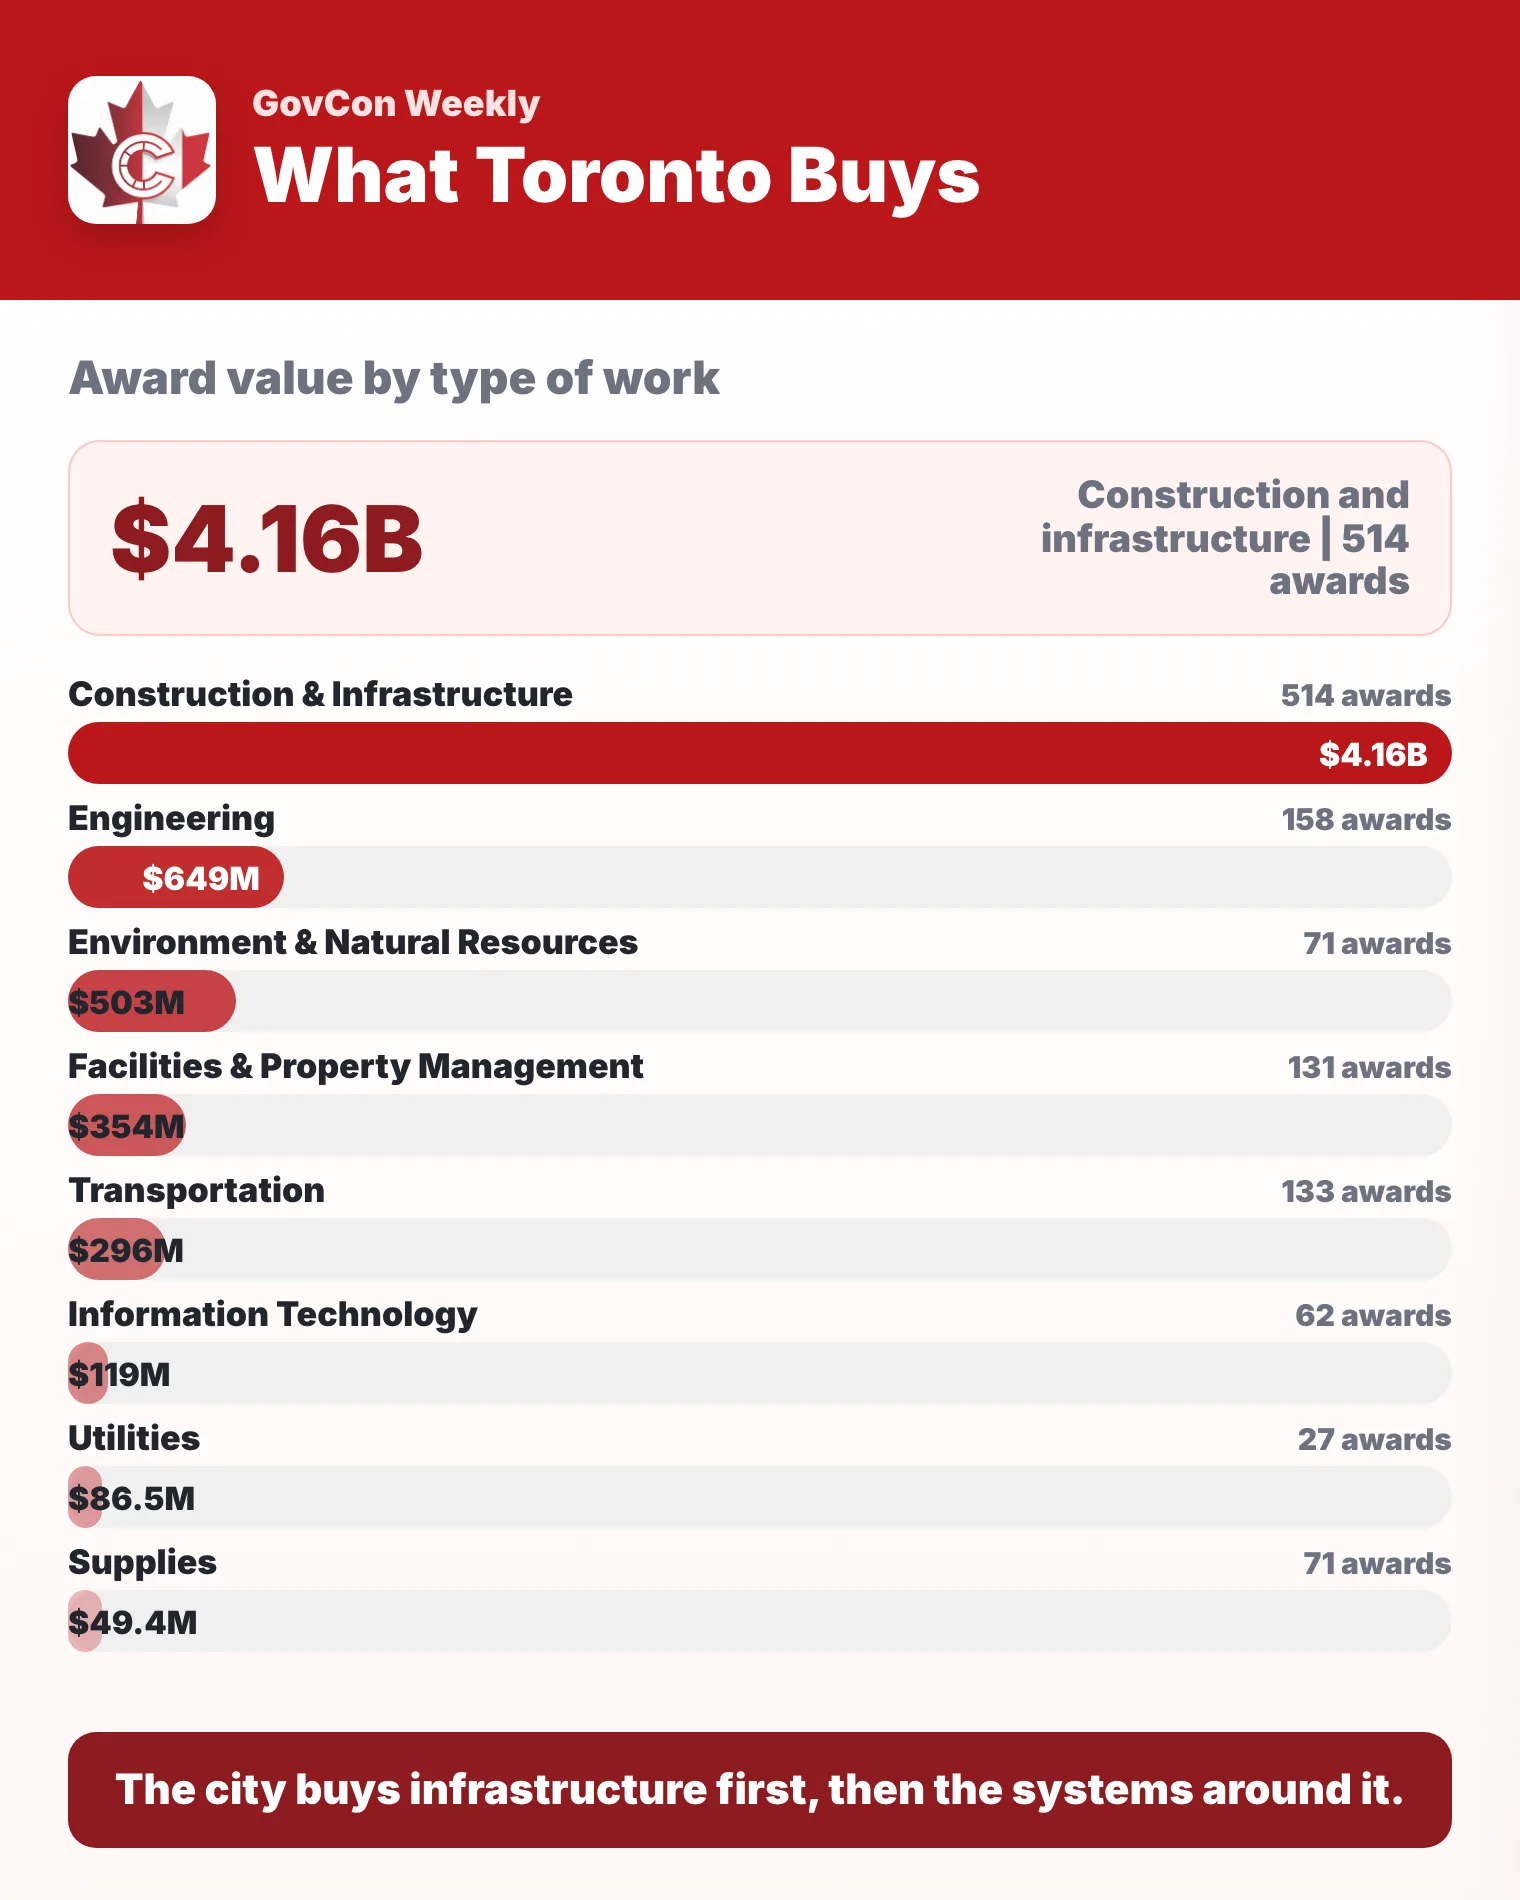
If you are looking for glamour, look elsewhere: this is a market made of concrete, pipes and asphalt. Construction and infrastructure is $4.16 billion, or 64.7 percent of five-year award value, from just over a third of the contracts. That is the signature of a market driven by major capital work. The categories below come from a cleaner reclassification of the city's own high-level procurement labels (award data).
| Type of work | Award value | Contracts | Vendors | Share |
|---|---|---|---|---|
| Construction and infrastructure | $4.16B | 514 | 181 | 64.7% |
| Engineering | $648.8M | 158 | 82 | 10.1% |
| Environment and natural resources | $502.5M | 71 | 52 | 7.8% |
| Facilities and property management | $353.7M | 131 | 108 | 5.5% |
| Transportation | $296.2M | 133 | 91 | 4.6% |
| Information technology | $119.3M | 62 | 52 | 1.9% |
| Utilities | $86.5M | 27 | 24 | 1.3% |
| Financial services | $51.2M | 34 | 30 | 0.8% |
| Supplies | $49.4M | 71 | 54 | 0.8% |
| Chemicals and fuels | $44.7M | 31 | 22 | 0.7% |
Source: City of Toronto awarded contracts open data, 2021 to 2025, classified and analysed by Publicus.
Engineering is second at $648.8 million, which separates design, studies, inspections and project expertise from the physical build. Environment and natural resources is third at $502.5 million, driven by waste, tree and natural-asset work. Facilities and transportation round out the top five and show the operating side of the city: buildings, elevators, safety systems, vehicles, fleet, traffic and ferry-related buying (category breakdown).
Pick your lane. The category you compete in decides who you are up against and how big the awards run, so know whether you are playing in the $4 billion construction pool or the smaller, more specialized engineering and IT ponds (how Publicus classifies awards).
Which City of Toronto divisions award the most contracts?
Engineering and Construction Services is the centre of the market, with $2.19 billion in tracked awards, 34 percent of the total. Toronto Water is second at $770.1 million and Parks, Forestry and Recreation third at $670.4 million (award data).
| Division | Award value | Contracts | Vendors | Share |
|---|---|---|---|---|
| Engineering and Construction Services | $2.19B | 170 | 75 | 34.0% |
| Toronto Water | $770.1M | 147 | 93 | 12.0% |
| Parks, Forestry and Recreation | $670.4M | 214 | 140 | 10.4% |
| Solid Waste Management Services | $488.3M | 69 | 53 | 7.6% |
| Corporate Real Estate Management | $470.2M | 111 | 78 | 7.3% |
| Engineering and Construction Services, Capital Works Delivery | $339.8M | 22 | 18 | 5.3% |
| Transportation Services | $287.9M | 139 | 70 | 4.5% |
| Fleet Services | $111.5M | 78 | 53 | 1.7% |
| Fire Services | $88.9M | 26 | 20 | 1.4% |
| Technology Services | $58.0M | 24 | 23 | 0.9% |
Source: City of Toronto awarded contracts open data, 2021 to 2025, classified and analysed by Publicus.
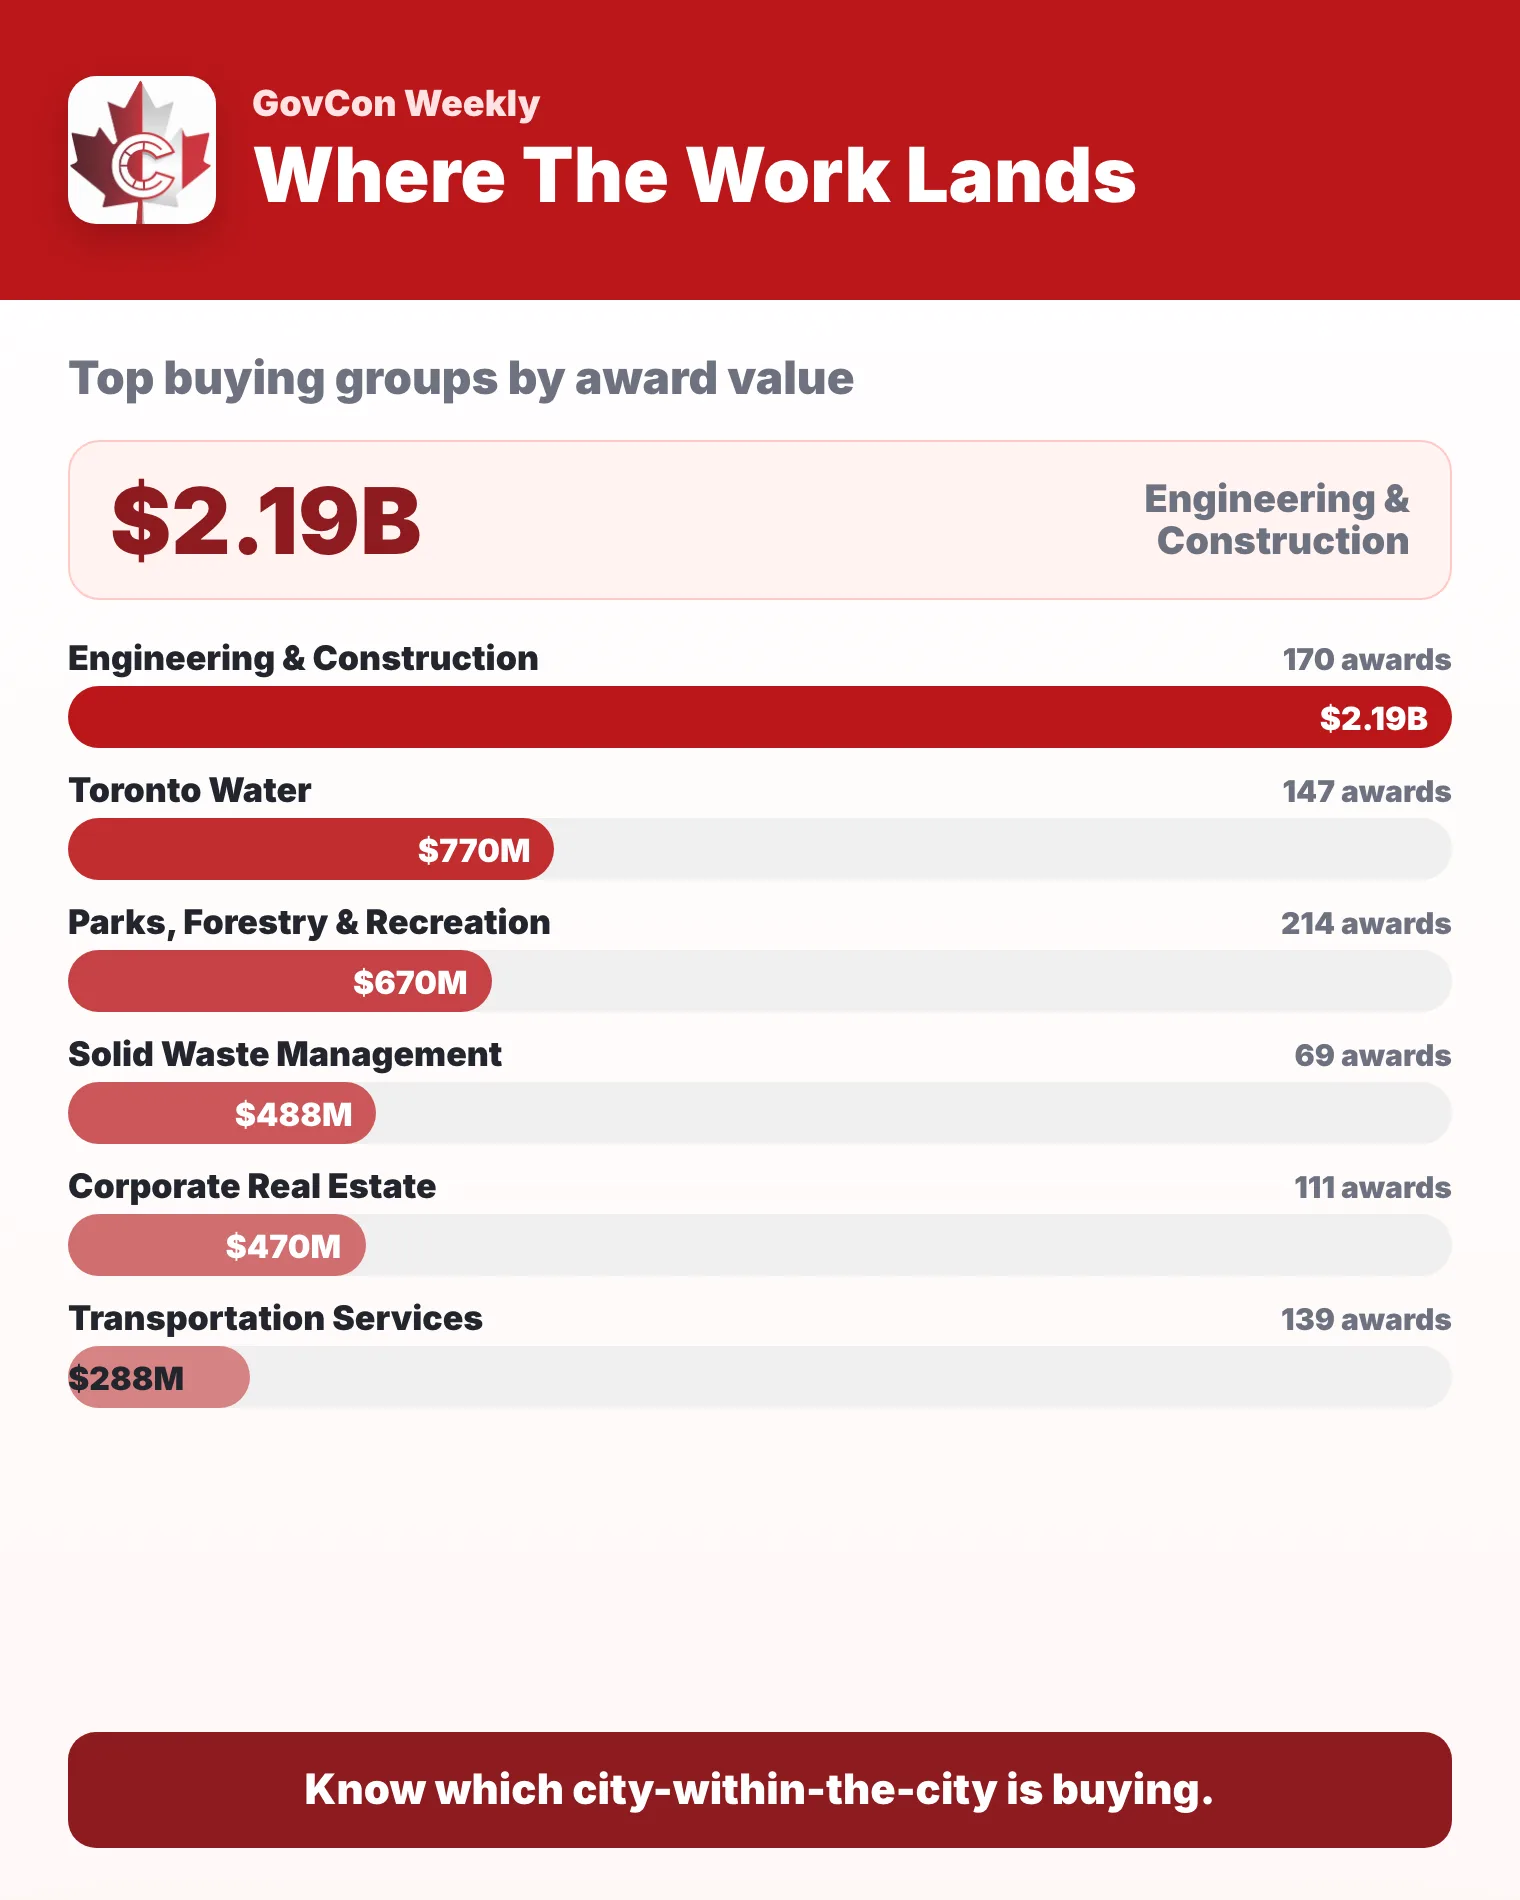
The bigger point is how different the buying profiles are. Engineering and Construction Services is high-value capital work. Toronto Water is recurring infrastructure renewal and treatment-plant work. Parks, Forestry and Recreation combines many smaller awards with the occasional large capital project. Solid Waste Management Services has fewer contracts but large service awards, and Corporate Real Estate Management buys building, facilities and property work. "Selling to Toronto" is too broad a strategy: the city is a collection of buyer communities, each with its own rhythm (Purchasing and Materials Management).
Who wins City of Toronto contracts?
The five-year vendor leaderboard is construction, water, waste, parks and infrastructure firms. Gio-Crete Construction leads at $543.2 million, 8.4 percent of tracked value, from five contracts (award data).
| Vendor | Award value | Contracts | Share |
|---|---|---|---|
| Gio-Crete Construction Ltd. | $543.2M | 5 | 8.4% |
| GFL Environmental Inc. | $340.1M | 4 | 5.3% |
| Bennett Mechanical Installations | $253.4M | 6 | 3.9% |
| Pomerleau Inc. | $222.0M | 2 | 3.4% |
| 2489960 Ontario Inc. | $172.2M | 8 | 2.7% |
| D. Crupi & Sons Limited | $149.5M | 10 | 2.3% |
| Viola Management Inc. | $142.5M | 20 | 2.2% |
| Kenaidan Contracting Ltd. | $139.4M | 2 | 2.2% |
| Aquicon Construction Co. Ltd. | $137.4M | 3 | 2.1% |
| 614128 Ontario Ltd. o/a Trisan Construction | $126.2M | 11 | 2.0% |
| GIP Paving Inc. | $124.7M | 3 | 1.9% |
| R.V. Anderson Associates Limited | $123.1M | 6 | 1.9% |
| GHD Limited | $121.3M | 11 | 1.9% |
| Damen Shipbuilding 5 B.V. | $90.6M | 1 | 1.4% |
| Capital Sewer Services Inc. | $84.1M | 7 | 1.3% |
Source: City of Toronto awarded contracts open data, 2021 to 2025, classified and analysed by Publicus.
Two different games are being played here, and they reward different things. The first is the major-award game, where a few large contracts can put a vendor at the top of the table. Gio-Crete's 2025 watermain and state-of-good-repair award is the largest single award in the five-year data, and Pomerleau's two large 2025 awards put it fourth on just two contracts (vendor analysis).
The second is the repeat-work game. 243 vendors won two or more awards over the period, and together they took $5.24 billion, or 81.4 percent of tracked value. That does not make the market closed. It means the highest-value parts of it reward firms that keep showing up across projects, scopes and cycles. In Toronto procurement, like in dating, the secret is not one grand gesture; it is showing up, reliably, year after year (Toronto award history).
Who leads construction, engineering and environmental work in Toronto?
The leaderboard changes with what the city is buying. The top vendors in construction are not the top vendors in engineering or in environmental work, so the overall ranking hides three separate markets. Category totals below count only a vendor's awards in that category, which is why GFL and GHD show slightly lower figures than in the overall table (category vendor tables).
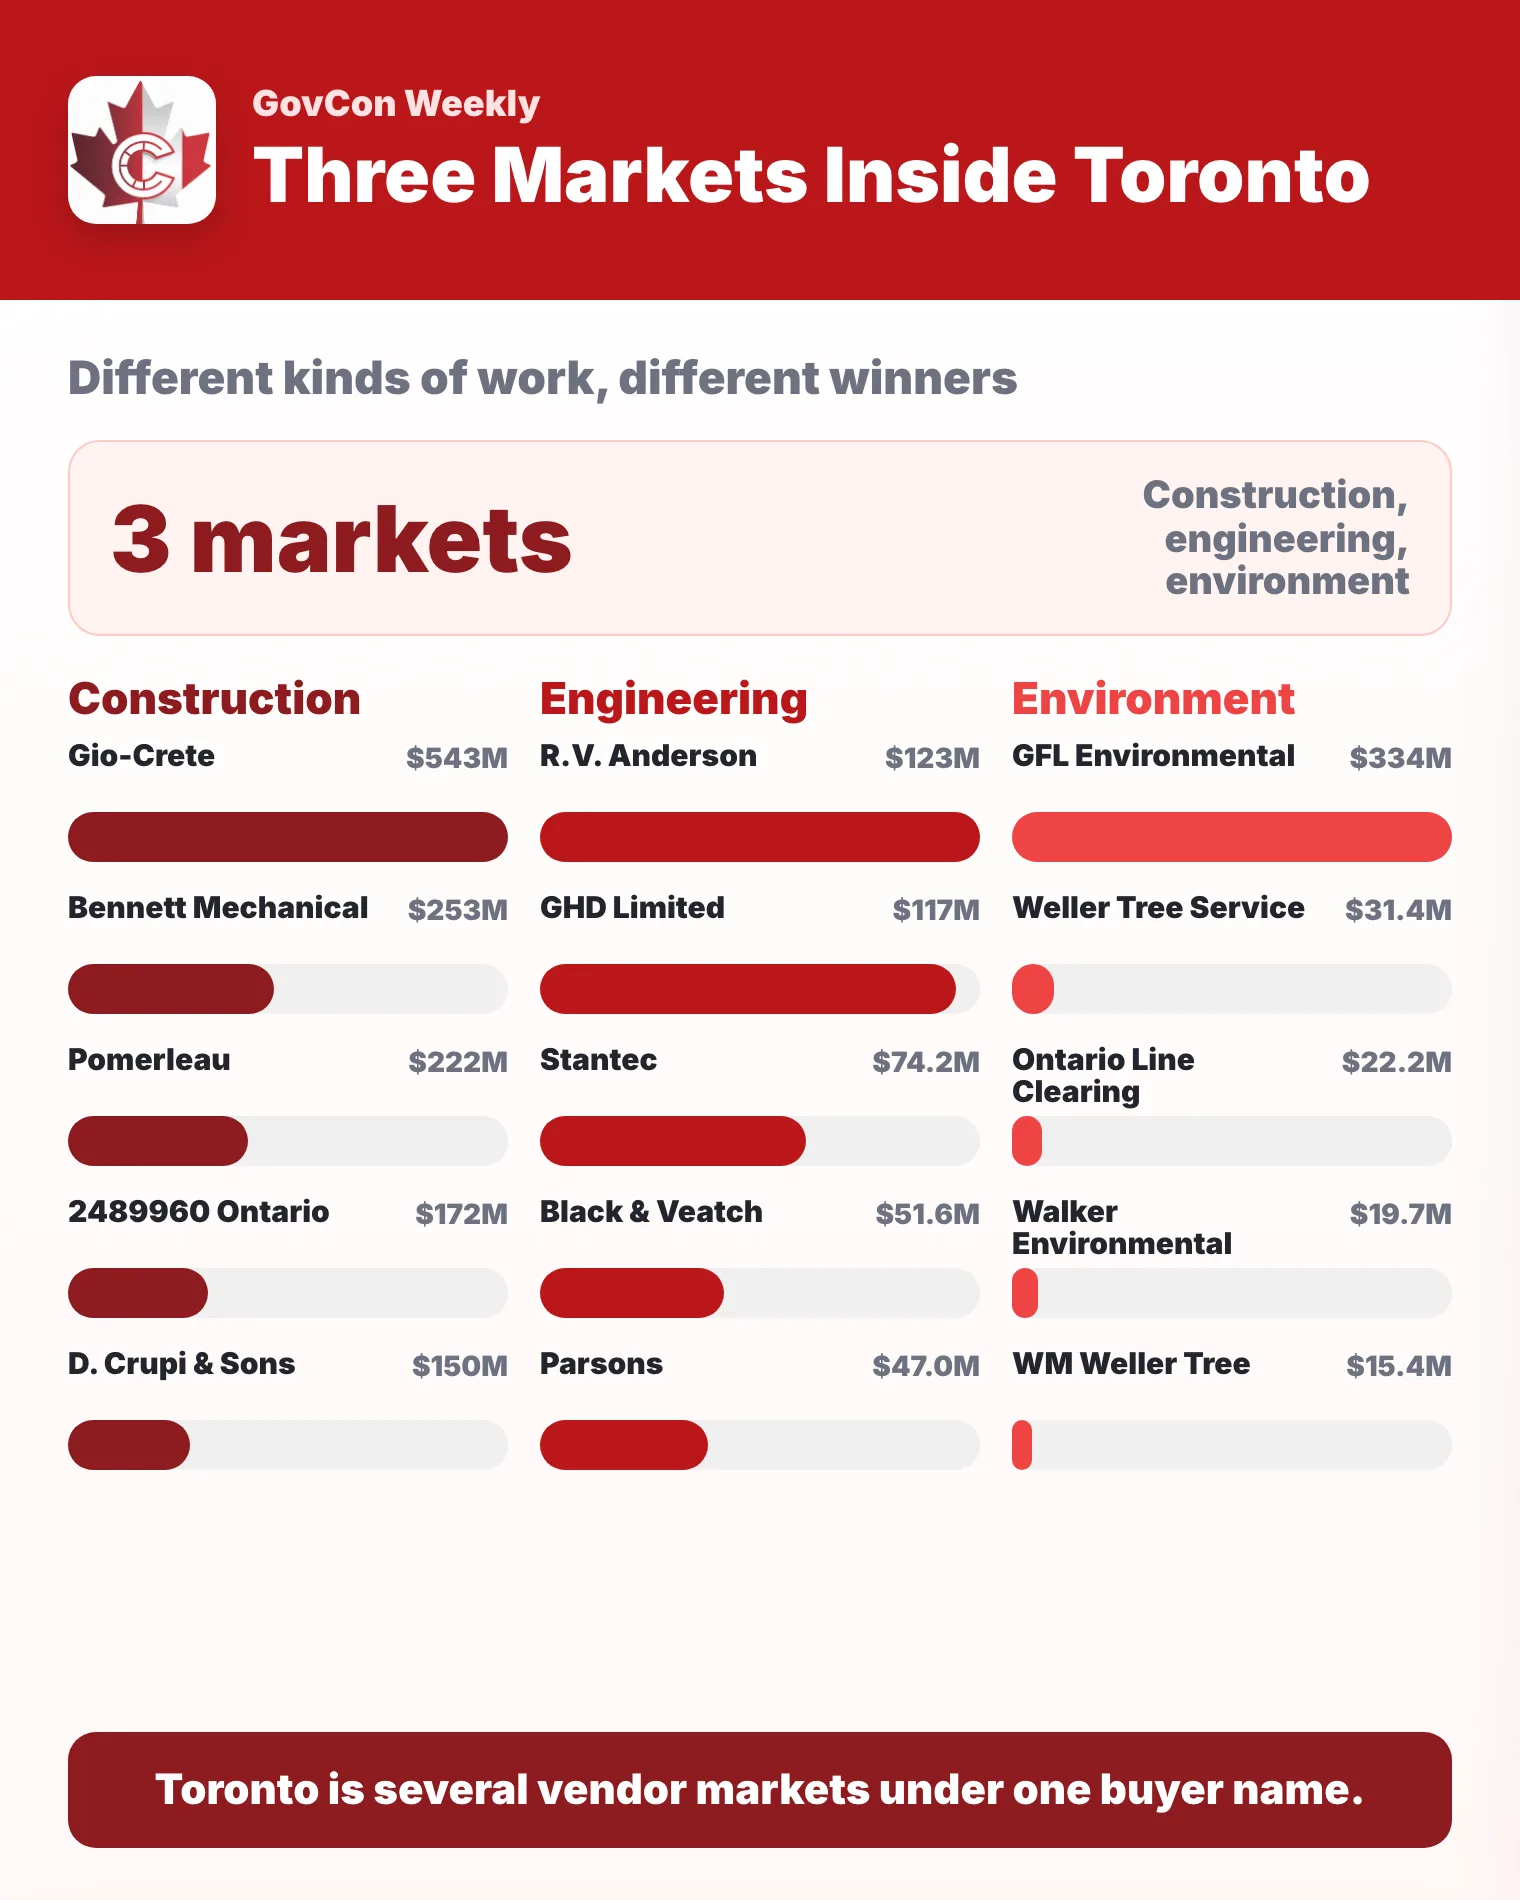
Construction and infrastructure is built around firms that can deliver large physical projects: watermain replacement, treatment-plant upgrades, parks facilities, paving and capital works. This is where one award can reshuffle the leaderboard.
| Construction vendor | Five-year value | Contracts |
|---|---|---|
| Gio-Crete Construction Ltd. | $543.2M | 5 |
| Bennett Mechanical Installations | $253.4M | 6 |
| Pomerleau Inc. | $222.0M | 2 |
| 2489960 Ontario Inc. | $172.2M | 8 |
| D. Crupi & Sons Limited | $149.5M | 10 |
| Viola Management Inc. | $142.5M | 20 |
| Kenaidan Contracting Ltd. | $139.4M | 2 |
| Aquicon Construction Co. Ltd. | $137.4M | 3 |
Source: City of Toronto awarded contracts open data, 2021 to 2025, classified and analysed by Publicus.
Engineering is the advisory and technical layer around the physical city: design, project management, inspections, studies and technical support.
| Engineering vendor | Five-year value | Contracts |
|---|---|---|
| R.V. Anderson Associates Limited | $123.1M | 6 |
| GHD Limited | $116.6M | 10 |
| Stantec Consulting Ltd. | $74.2M | 6 |
| Black & Veatch Canada Company | $51.6M | 2 |
| Parsons Inc. | $47.0M | 6 |
| Morrison Hershfield Limited | $46.8M | 3 |
| AECOM Canada Ltd. | $26.7M | 8 |
| Arcadis Professional Services (Canada) Inc. | $21.6M | 5 |
Source: City of Toronto awarded contracts open data, 2021 to 2025, classified and analysed by Publicus.
Environment and natural resources is waste, trees and environmental operations, and it is the most top-heavy of the three: one waste contractor holds most of the value, followed by a long line of tree-care firms.
| Environment vendor | Five-year value | Contracts |
|---|---|---|
| GFL Environmental Inc. | $334.1M | 3 |
| Weller Tree Service Ltd. | $31.4M | 1 |
| Ontario Line Clearing & Tree Expert | $22.2M | 2 |
| Walker Environmental Group Inc. | $19.7M | 5 |
| WM Weller Tree Services Ltd. | $15.4M | 2 |
| Davey Tree Expert Co. | $12.1M | 1 |
| Asplundh Canada ULC | $10.9M | 2 |
| Salivan Landscape Ltd. | $9.2M | 2 |
Source: City of Toronto awarded contracts open data, 2021 to 2025, classified and analysed by Publicus.
What technology does the City of Toronto buy?
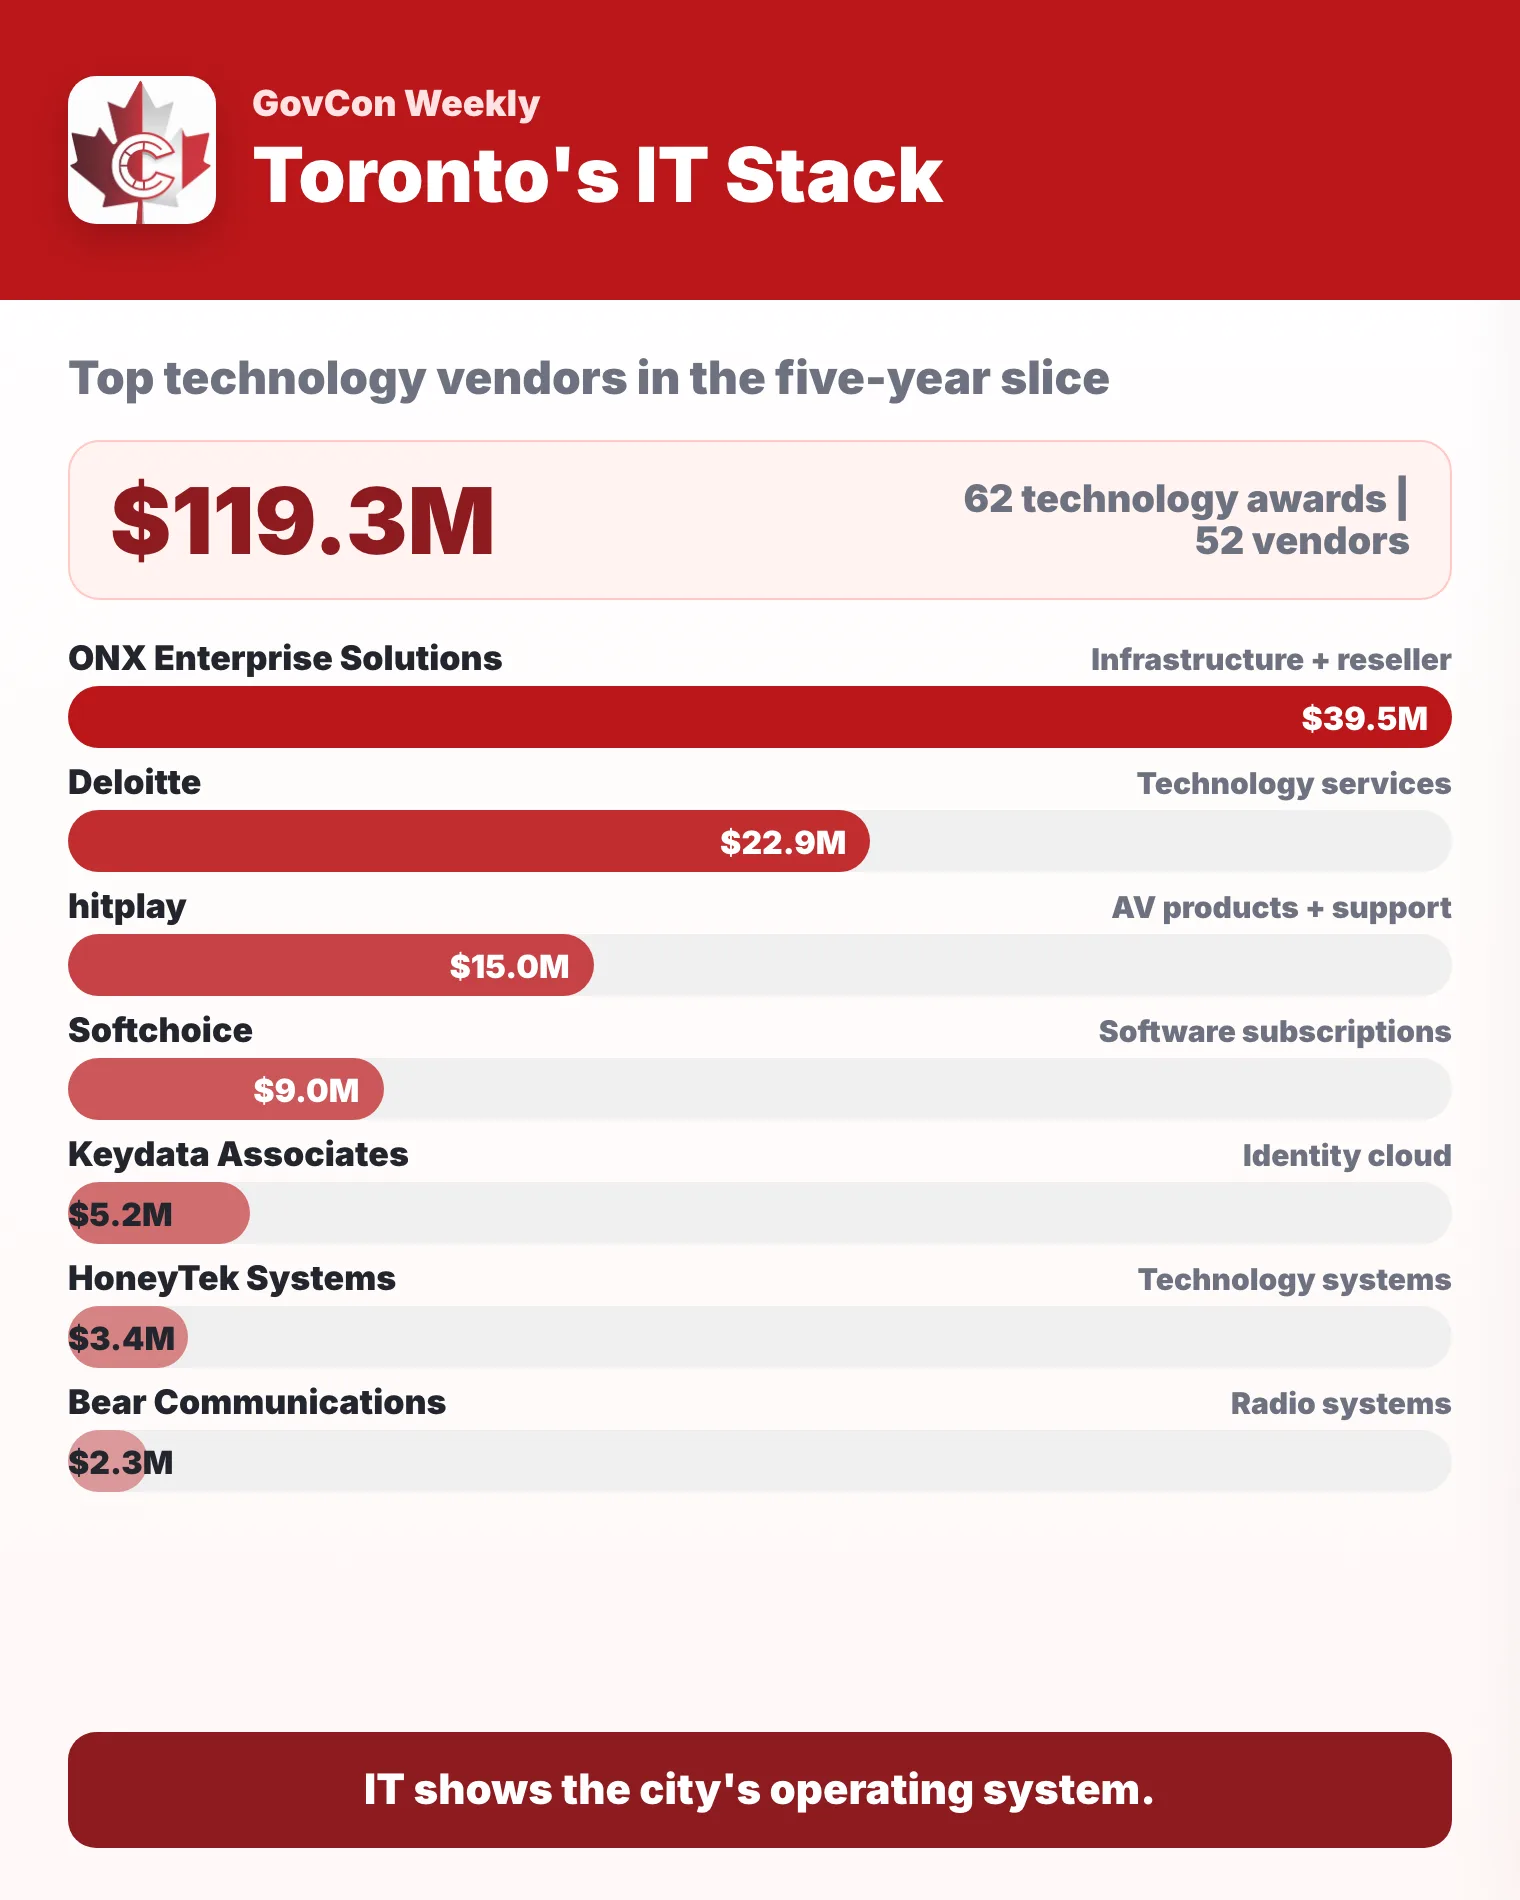
Information technology is a small slice of Toronto's market, $119.3 million across 62 awards and 52 vendors from 2021 to 2025, but it shows what the city runs on. A broader processed IT file covering 2012 to 2026 identifies $469.4 million in IT-related contracting across 204 vendors (award data).
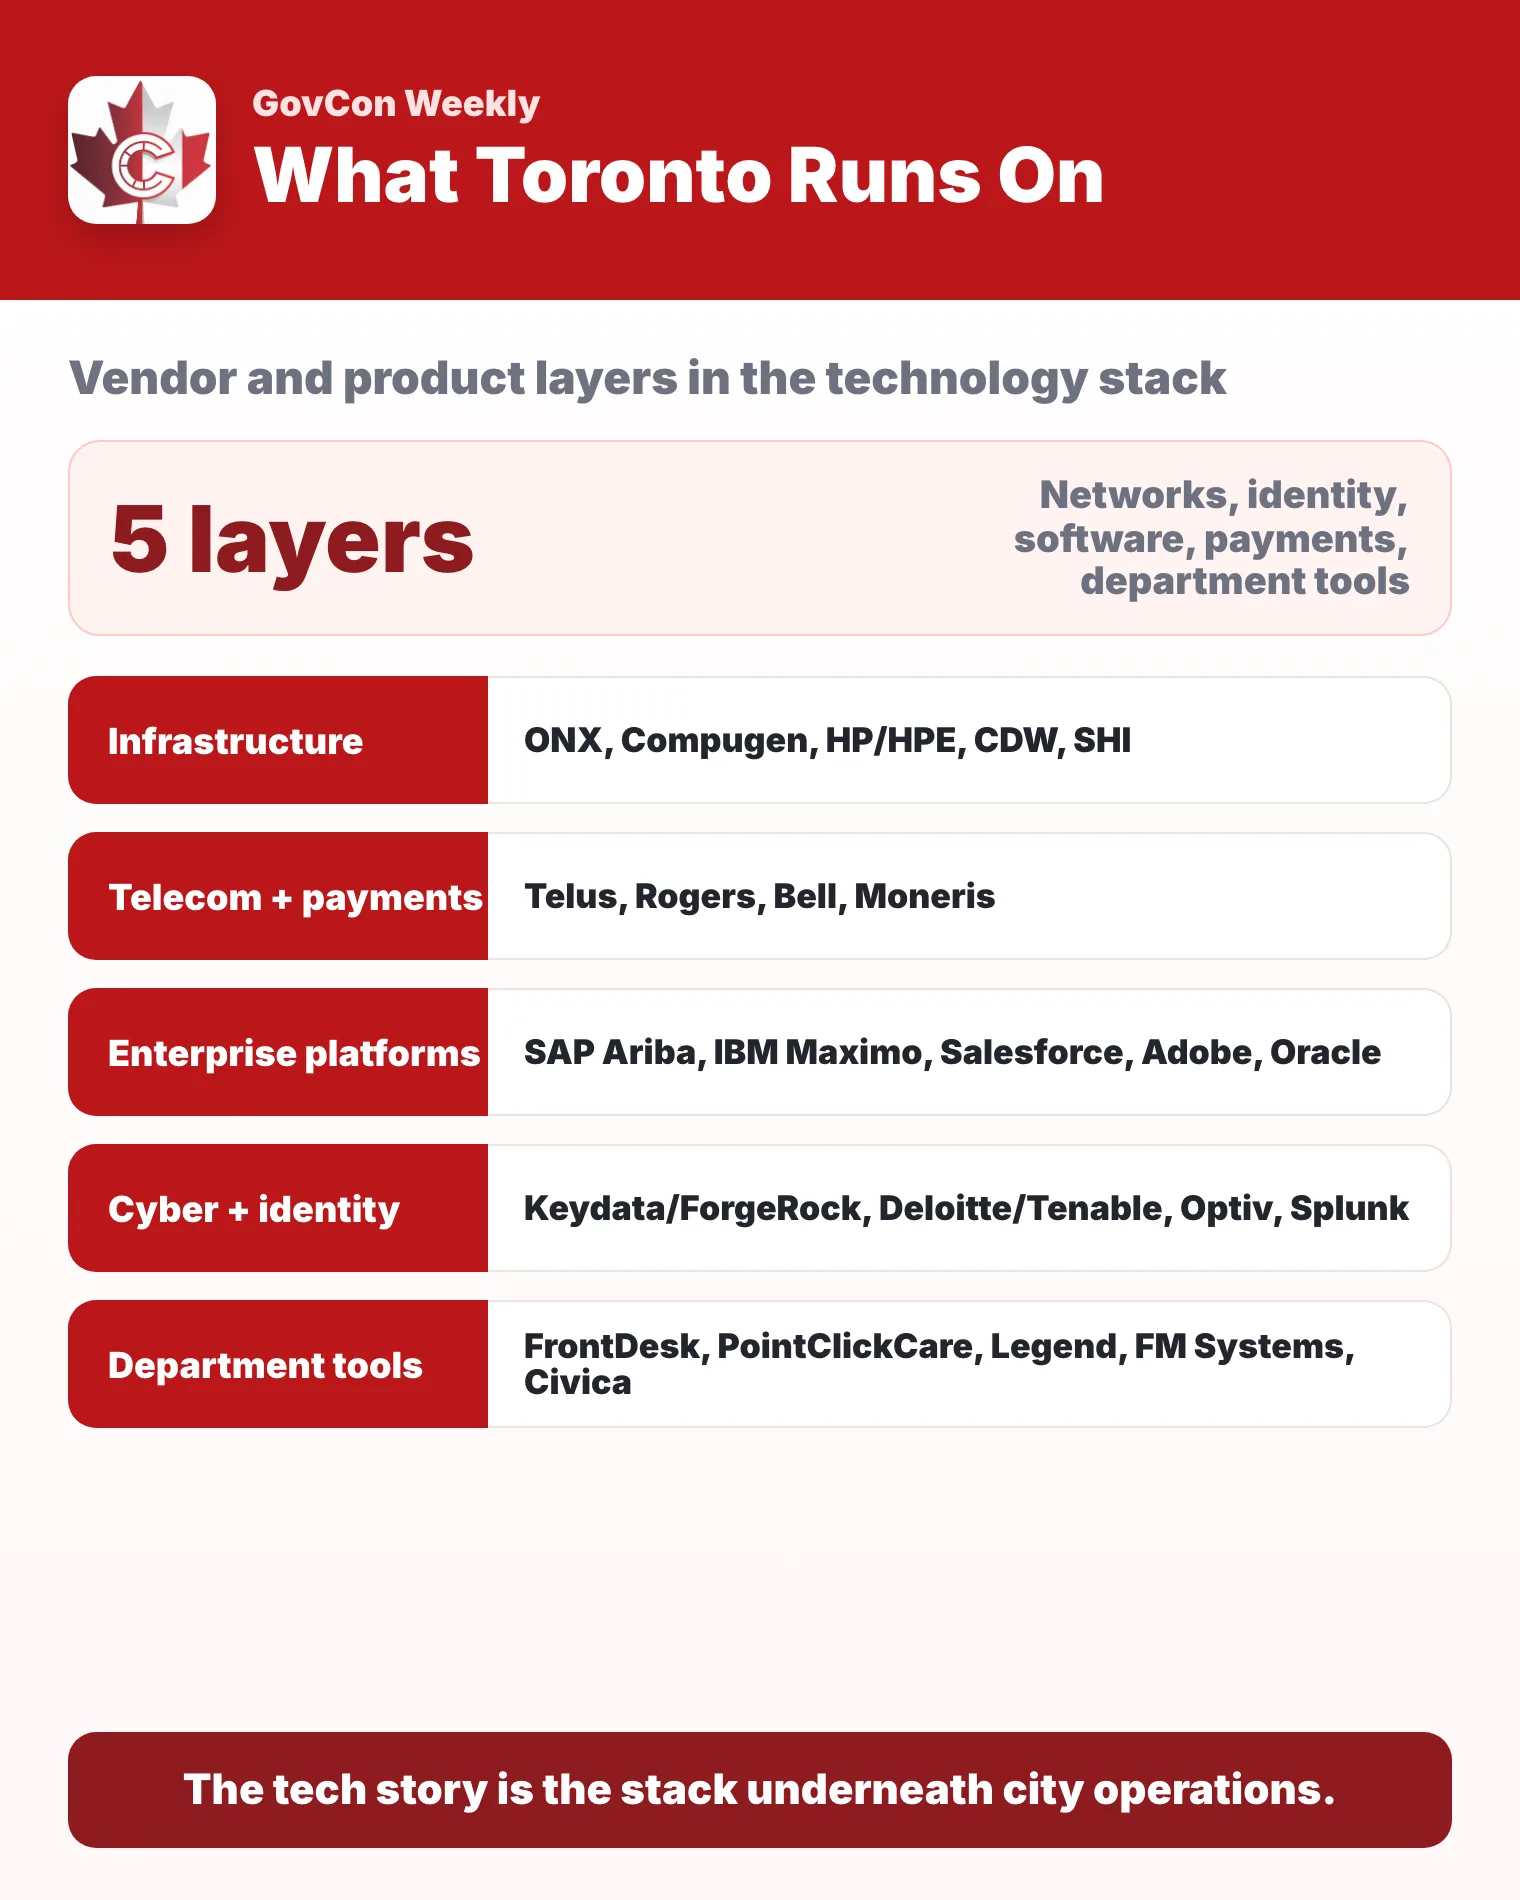
Read it as a stack rather than one category, the way you would read a layer cake, except this one runs the city instead of feeding it (IT deep dive).
| Layer | Representative vendors and products | What it tells us |
|---|---|---|
| Infrastructure and resellers | ONX, Compugen, HP/HPE, CDW, SHI | Hardware, storage, networking, software subscriptions and reseller-managed technology buying. |
| Telecom and payments | Telus, Rogers, Bell, Moneris | Connectivity, wireless, mobile, payment processing and operational communications. |
| Enterprise platforms | An e-procurement suite, IBM Maximo, Salesforce ECRM, Adobe, Oracle | Procurement, asset management, CRM, creative and document tools, analytics and enterprise systems. |
| Cybersecurity and identity | Keydata / ForgeRock, Deloitte / Tenable, Optiv, Talos, Splunk, Entrust | Identity, vulnerability management, threat intelligence, certificates and monitoring. |
| Department-specific systems | FrontDesk, PointClickCare, Legend, FM Systems, Resolver, Civica, Autodesk tools | Software bought for specific needs in parks, water, facilities, long-term care, risk and service delivery. |
Source: City of Toronto awarded contracts and a processed 2012 to 2026 IT file, analysed by Publicus.
The top IT vendors in the 2021 to 2025 data are led by ONX Enterprise Solutions at $39.5 million across five awards (award data).
| Vendor | Five-year IT value | Awards |
|---|---|---|
| ONX Enterprise Solutions Ltd. | $39.5M | 5 |
| Deloitte Inc. | $22.9M | 3 |
| hitplay | $15.0M | 1 |
| Softchoice LP | $9.0M | 1 |
| Keydata Associates Inc. | $5.2M | 1 |
| HoneyTek Systems Inc. | $3.4M | 1 |
| Bear Communications Inc. | $2.3M | 1 |
| BearCom Canada Corporation | $2.3M | 1 |
| Ricoh Canada Inc. | $1.6M | 2 |
| ePlanSoft | $1.6M | 1 |
Source: City of Toronto awarded contracts open data, 2021 to 2025, classified and analysed by Publicus.
The longer IT view adds product detail. ONX shows up as a major infrastructure reseller tied to Cisco and Cisco Meraki networking, Hitachi storage, F5 load balancers, OpenText and Micro Focus renewals, Symantec endpoint protection and data-centre cabinets. Compugen appears around hardware supply, Softchoice in the Adobe subscription line, and Keydata with ForgeRock identity cloud. Telecom vendors sit under a large communications blanket contract with Telus, Rogers, Bell Mobility, Wireless Systems Solutions, Paging Network of Canada and Baka Communications.
That makes the IT story different from the construction story. In construction, the vendor table tells you who can deliver physical projects. In IT, it tells you which vendors sit between the city and the platforms it depends on.
How much of Toronto's contract value goes to Ontario firms?
Ontario-classified vendors won $4.48 billion, or 69.6 percent of five-year award value, nearly seven in ten dollars. Canadian vendors outside the Ontario bucket add $742.3 million, and foreign-classified vendors account for $1.20 billion, concentrated in a smaller set of large awards (award data).
| Classification | Award value | Contracts | Vendors | Share |
|---|---|---|---|---|
| Ontario | $4.48B | 963 | 495 | 69.6% |
| Foreign | $1.20B | 258 | 134 | 18.7% |
| Canadian (outside Ontario) | $742.3M | 103 | 70 | 11.5% |
| Unclassified | $11.8M | 103 | 94 | 0.2% |
Source: City of Toronto awarded contracts open data, 2021 to 2025, classified and analysed by Publicus.
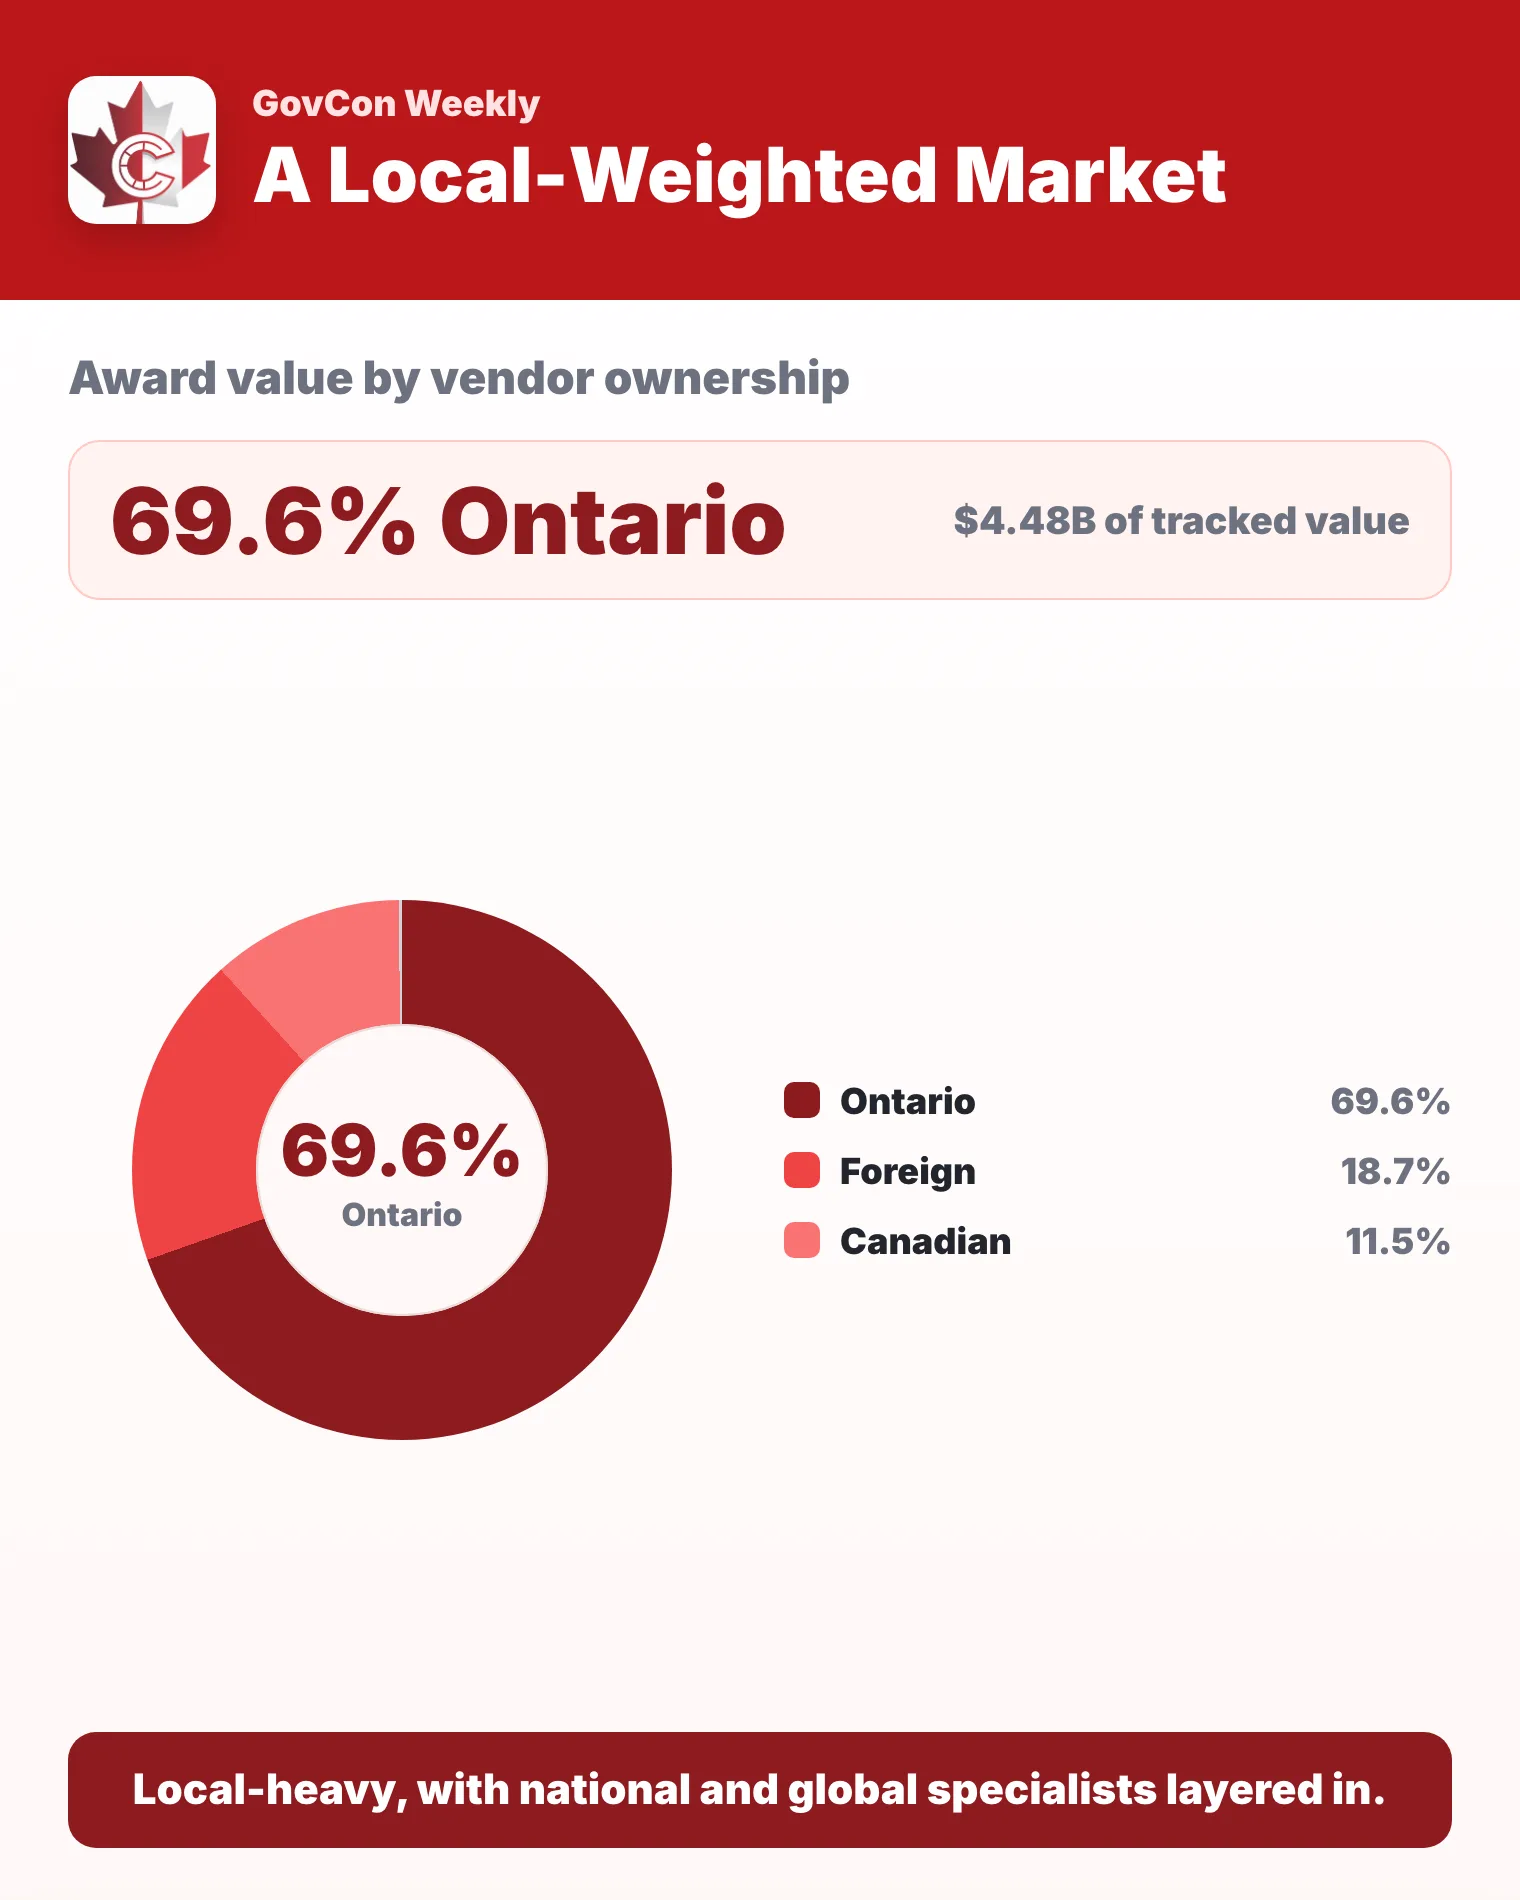
Toronto is a heavily local supplier market, but not an exclusively local one. Large infrastructure, marine, engineering, technology and specialized service work still brings in national and international firms. Foreign-classified vendors hold less than a fifth of the value, but they show up in some of the largest and most specialized awards (vendor records).
How does Toronto tender its work, and how big are the contracts?
Requests for tender are the value channel, with $3.73 billion in tracked awards and an average award of $7.9 million. Requests for quotation are the volume channel, with 538 contracts and the broadest vendor pool. Requests for proposal sit between the two, used where solution quality, professional judgement or scope design matter more than lowest price (how the city solicits bids).
| Solicitation type | Award value | Contracts | Vendors | Average award |
|---|---|---|---|---|
| RFT (request for tender) | $3.73B | 471 | 175 | $7.9M |
| RFQ (request for quotation) | $1.34B | 538 | 392 | $2.5M |
| RFP (request for proposal) | $1.03B | 326 | 229 | $3.1M |
| NRFP (negotiated request for proposal) | $293.1M | 9 | 8 | $32.6M |
| RFSQ (request for supplier qualification) | $43.4M | 78 | 66 | $556K |
Source: City of Toronto awarded contracts open data, 2021 to 2025, classified and analysed by Publicus.
Contract size is the other big signal. Just 136 contracts above $10 million account for 67.7 percent of five-year award value, and the five contracts above $100 million alone are 17.0 percent. There is a long tail of smaller awards, but the dollars sit in major projects and large recurring-service arrangements (contract size analysis).
| Contract threshold | Award value | Contracts | Share of total |
|---|---|---|---|
| $10M+ | $4.36B | 136 | 67.7% |
| $25M+ | $2.90B | 42 | 45.1% |
| $50M+ | $2.16B | 20 | 33.6% |
| $100M+ | $1.09B | 5 | 17.0% |
Source: City of Toronto awarded contracts open data, 2021 to 2025, classified and analysed by Publicus.
Where should contractors look next in Toronto?
The data points to a handful of places worth watching (doing business with the City of Toronto):
- The 2025 reset. Award value reached $2.31 billion in 2025, the largest full year in the 2021 to 2025 window (award data).
- Water and state of good repair. Toronto Water and the engineering divisions appear again and again among the largest awards, with watermain, treatment-plant and capital renewal work driving major contracts.
- Parks as a capital buyer. Parks, Forestry and Recreation is not just small local work. It is the third-largest named division, with 214 contracts and $670.4 million in awards (division detail).
- Solid waste as a large service market. Solid Waste Management Services has fewer contracts than parks or transportation, but collection, transportation and off-loading contracts are large.
- Repeat vendors. The repeat-vendor group holds 81.4 percent of tracked value. This is a relationship-and-capability market, especially in capital-heavy categories (repeat-vendor analysis).
- RFQ breadth. RFQs have the most contracts and vendors, the best evidence that small and mid-sized suppliers still have room beneath the mega-project layer.
- The technology stack. IT is not the largest part of Toronto procurement, but it is a useful lens on how the city operates: identity, networking, storage, payments, communications, document tools, asset management and department systems.
Toronto's procurement market is easy to underestimate because the work is ordinary on purpose: roads, watermains, parks, buildings, waste collection, fleet, engineering, repair and replacement. For contractors it is less a single opportunity than a map, and the map says follow water, engineering, parks, real estate, waste and the annual rhythm of capital renewal. Watermains will never trend on social media, but they will outlast every app on this list, and in Toronto that is exactly where the money is.
About the data
Figures cover tracked City of Toronto awards from 2021 through 2025, the last five complete years, drawn from the city's awarded contracts open data and reclassified by Publicus into cleaner categories than the city's high-level procurement labels. Vendor location comes from a classified and enriched vendor file, so "Ontario", "Canadian" and "foreign" describe how vendors were classified, with $11.8 million left unclassified. Totals include only awards the city publishes, so they are a floor rather than everything the city buys. The broader IT figure comes from a separate processed file covering 2012 to 2026 and is not comparable to the five-year totals. This analysis first appeared in GovCon Weekly on June 16, 2026.
- toronto
- municipal procurement
- market map
- govcon weekly