Quebec Government Technology Procurement: The $20B Market
ARTICLE SUMMARY
Quebec's public sector awarded about $20.4 billion in visible technology contracts between FY20 and FY26, out of roughly $28.4 billion in total procurement, across 1,074 public buyers and 13,869 suppliers, based on SEAO...
- For
- Vendors, buyers, and readers following Canadian procurement
- Main topic
- Market Maps
- Why it matters
- The article's argument is summarized up front so people and agents can grasp the point before reading the full body.
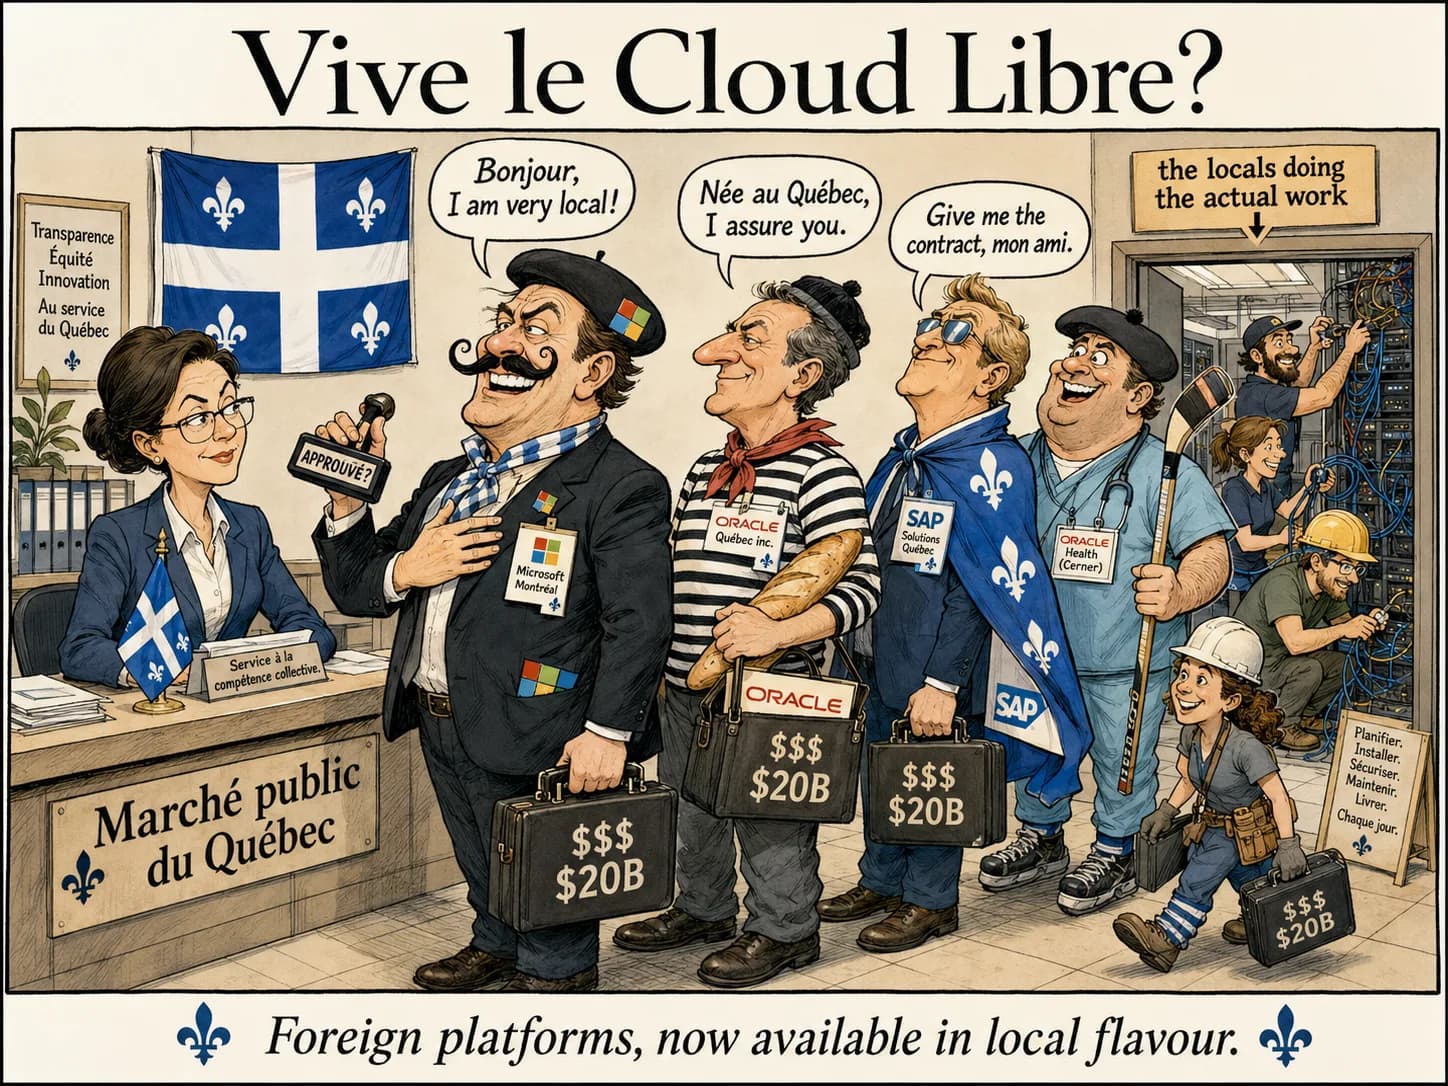
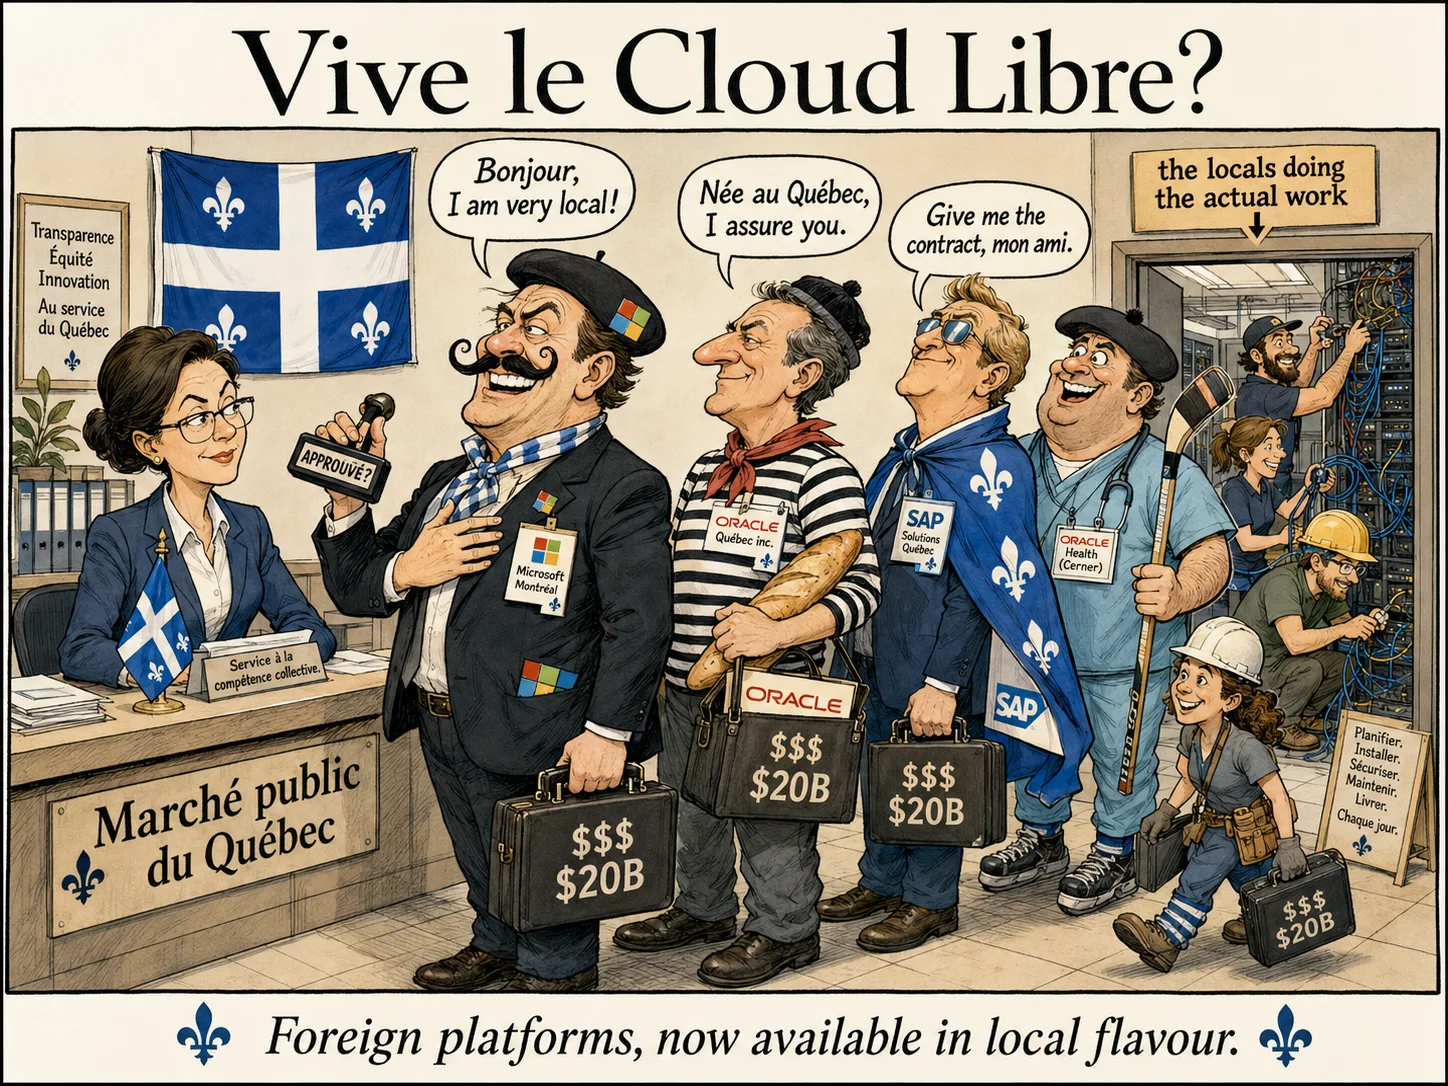
Quebec's public sector awarded about $20.4 billion in visible technology contracts between FY20 and FY26, out of roughly $28.4 billion in total procurement, across 1,074 public buyers and 13,869 suppliers, based on SEAO and municipal award records. Where ownership can be identified, 49.4 percent of that money goes to Canadian firms. The split follows the technology stack: foreign companies own the platforms, and Quebec and Canadian firms run the services layer on top. This page maps who buys, what they buy and who wins.
How big is the Quebec government technology market?
Technology is $20.4 billion of Quebec's $28.4 billion in visible public procurement over FY20 to FY26, about 72 percent. Everything else, from construction to office supplies, is the other $7.9 billion. The data covers every provincial ministry and agency, every CIUSSS, every CEGEP and hundreds of towns, drawn from the province's electronic tendering system and municipal records (full GovCon Weekly analysis).
These are publicly visible awards, which makes them a floor and not a ceiling. Contracts with undisclosed values, and purchasing routed through channels the public records miss, are not captured, so the real market is larger than anything on this page (SEAO open data).
How much of Quebec's technology money stays in Canada?
Where the supplier's owner can be identified, 49.4 percent of technology dollars go to Canadian firms. Quebec-based firms take the largest single slice, 37.2 percent or $7.1 billion, more than the rest of Canada combined. That slice is the reason the domestic total gets close to half (ownership analysis).
| Where the identified money goes | Share |
|---|---|
| Quebec-based firms | 37.2% ($7.1B) |
| Rest-of-Canada firms | About 12% ($2.3B) |
| Canadian total | 49.4% |
| Foreign firms | About 50.6% |
Source: publicly visible awards from SEAO and Quebec municipal records, FY20 to FY26, analysed by Publicus.
The split is not random. The platform layer, meaning operating systems, databases, enterprise software and electronic health records, comes from a short list of foreign owners with no domestic substitute. The services layer, meaning integration, consulting, staffing and telecom, is where Canadian and Quebec firms hold ground, and most of the Canadian share sits there (award records).
That reframes any "buy Quebec" or "buy Canadian" debate. The half that leaves the country is not leaving because local vendors are weak. It leaves because the products underneath are foreign by nature. The realistic lever is not replacing the platforms; it is capturing more of the services and integration work that sits on top of them, which is already mostly Canadian and is the only part of the stack where local content can grow (GovCon Weekly).
What technology does the Quebec government buy?
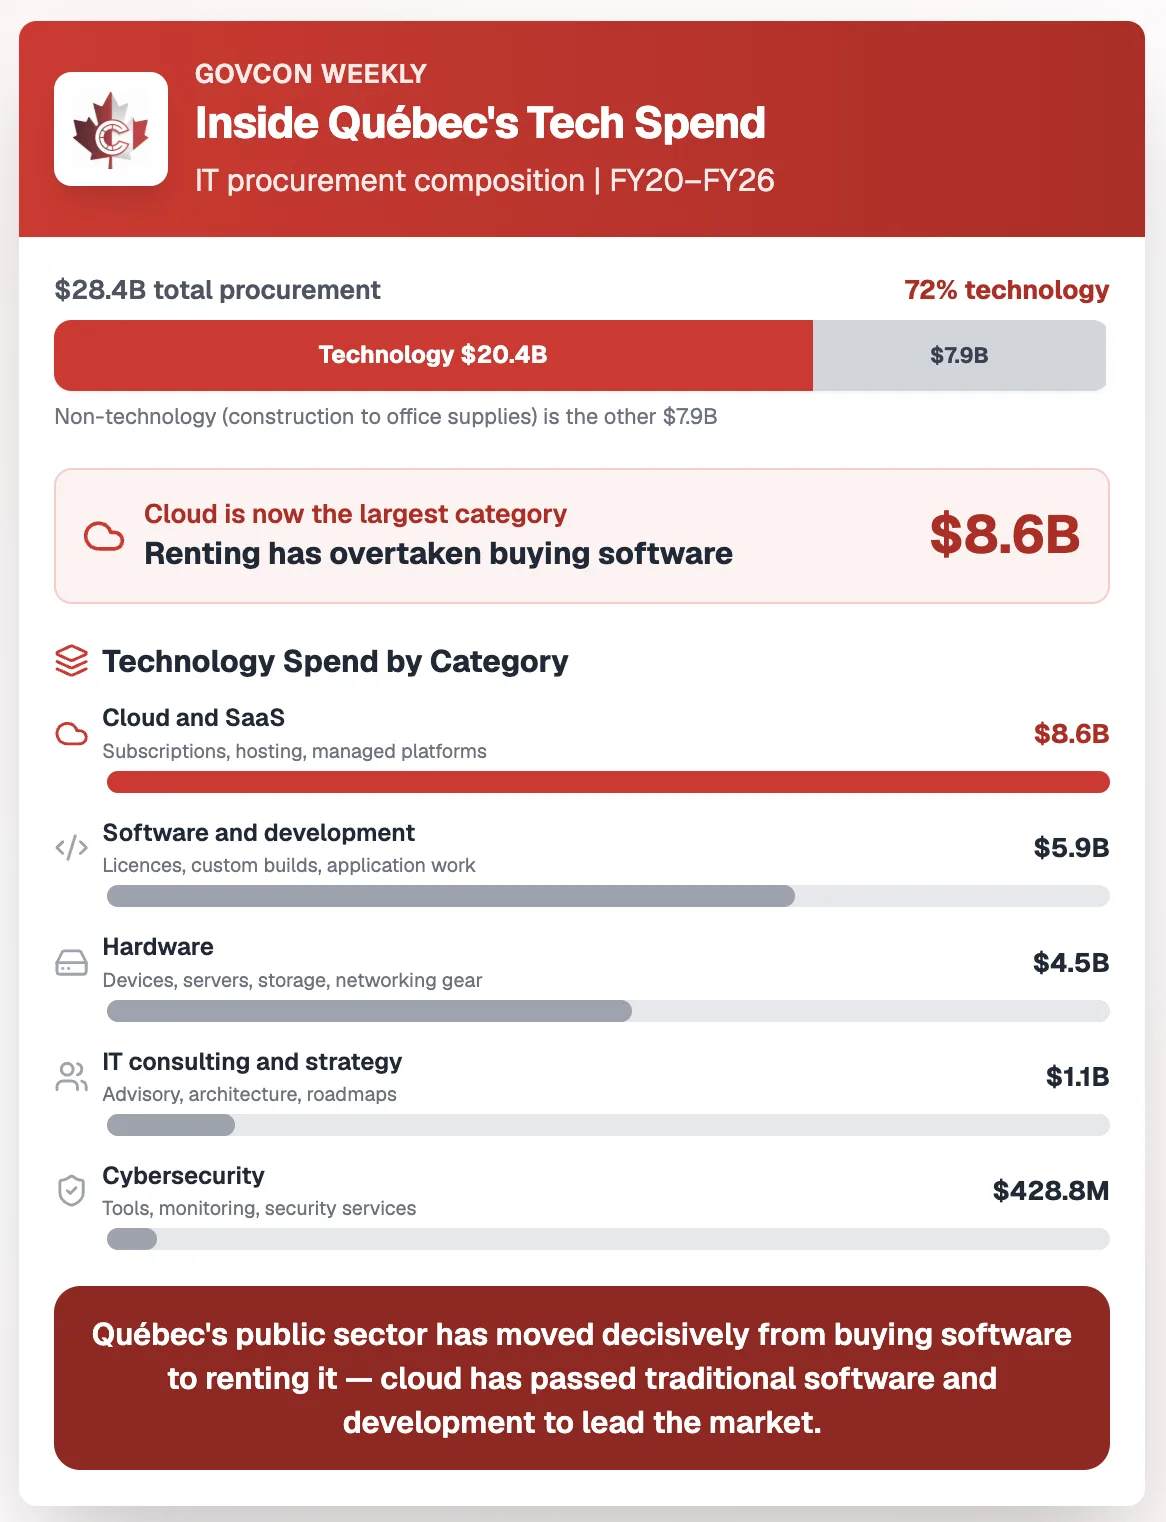
Cloud is now the largest category in the province at $8.6 billion. Quebec's public sector has moved decisively from buying software to renting it, and cloud has passed traditional software and development to lead the market (SEAO award data).
| IT category | Value (FY20 to FY26) | What it is |
|---|---|---|
| Cloud and SaaS | $8.6B | Subscriptions, hosting, managed platforms |
| Software and development | $5.9B | Licences, custom builds, application work |
| Hardware | $4.5B | Devices, servers, storage, networking gear |
| IT consulting and strategy | $1.1B | Advisory, architecture, roadmaps |
| Cybersecurity | $428.8M | Tools, monitoring, security services |
Source: publicly visible awards from SEAO and Quebec municipal records, FY20 to FY26, analysed by Publicus.
Renting changes the buyer. What used to be a one-time capital purchase is now a recurring annual commitment, which makes the buyer stickier and the incumbent much harder to displace. If you sell technology to Quebec, the $8.6 billion cloud number is your map: the winning move is rarely a standalone product, it is landing inside a platform relationship and expanding from there (category analysis).
Cybersecurity looks small because it hides. At $428.8 million it reads low, but a large share of security work is bundled inside cloud and managed-service contracts rather than bought as a named line. Treat it as a floor and a signal, not a verdict. An under-bought category in a jurisdiction this size is a place to look, not to avoid (award records).
Which Quebec public bodies buy the most technology?
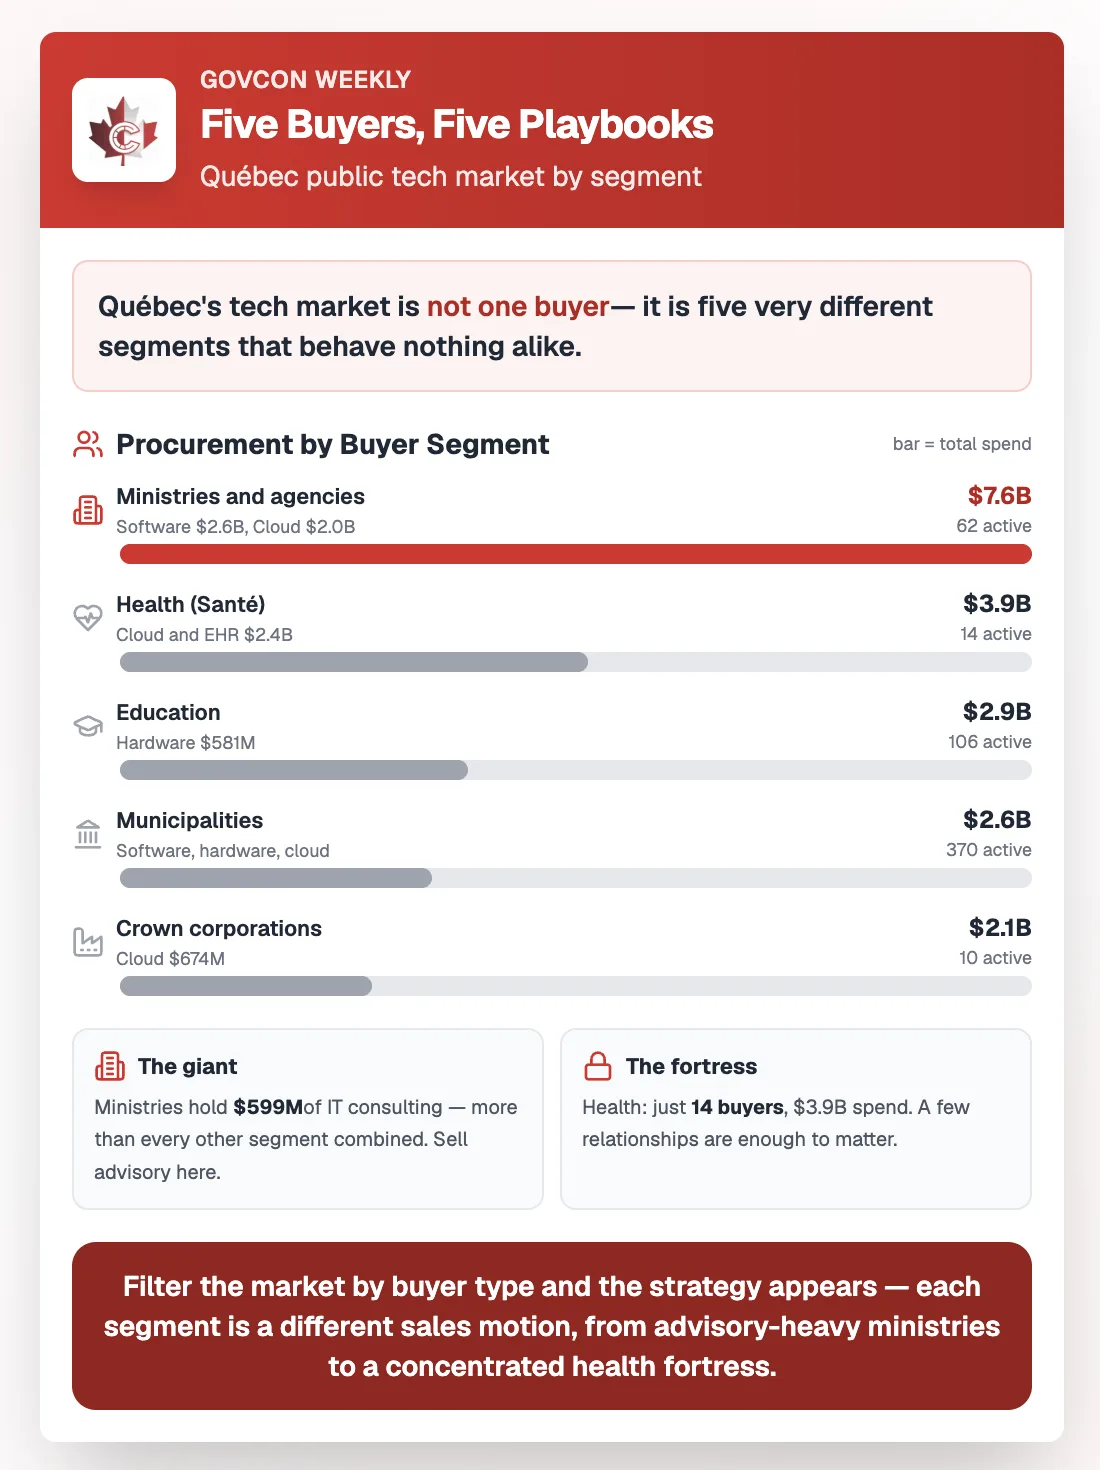
Quebec's public technology market is not one buyer. It is five segments that behave nothing alike, and the contrast between them is the strategy (SEAO and municipal records).
| Buyer segment | Public buyers | Total procurement | Dominant IT category |
|---|---|---|---|
| Ministries and agencies | 77 (62 active) | $7.6B | Software $2.6B, Cloud $2.0B |
| Health (Santé) | 17 (14 active) | $3.9B | Cloud and EHR $2.4B |
| Education | 132 (106 active) | $2.9B | Hardware $581M |
| Municipalities | 462 (370 active) | $2.6B | Software, hardware, cloud |
| Crown corporations | 13 (10 active) | $2.1B | Cloud $674M |
Source: publicly visible awards from SEAO and Quebec municipal records, FY20 to FY26, analysed by Publicus.
Ministries and agencies are the giant. Sixty-two active buyers account for $7.6 billion, weighted toward software and cloud. They are also where the consulting money lives: roughly $599 million on IT consulting and strategy, more than every other segment combined. If you sell integration or advisory, this is the room (example: Ministère des Transports et de la Mobilité durable).
Health is small in doors and enormous in dollars. Only 14 buyers show meaningful activity, yet they account for $3.9 billion, and $2.4 billion of that is cloud and electronic health record platforms. It is the most concentrated segment in the province. For an incumbent that concentration is a fortress; for a challenger it means winning a few relationships is enough to matter (example: CIUSSS de l'Estrie-CHUS).
Education buys differently from everyone. It is the only segment where hardware leads, at $581 million, ahead of cloud and software. That is devices flowing into CEGEPs, universities and school service centres such as the Centre de services scolaire de Montréal and Université Laval. Education is a volume hardware market wearing a technology label.
Municipalities are the long tail. 370 active town and city buyers account for $2.6 billion between them, split almost evenly across software, hardware and cloud. Buyers such as the City of Montreal's IT department and the Ville de Québec are one door among hundreds. The market is real but spread across many small independent purchasers, the opposite of an enterprise sale.
Who sells technology to the Quebec government?
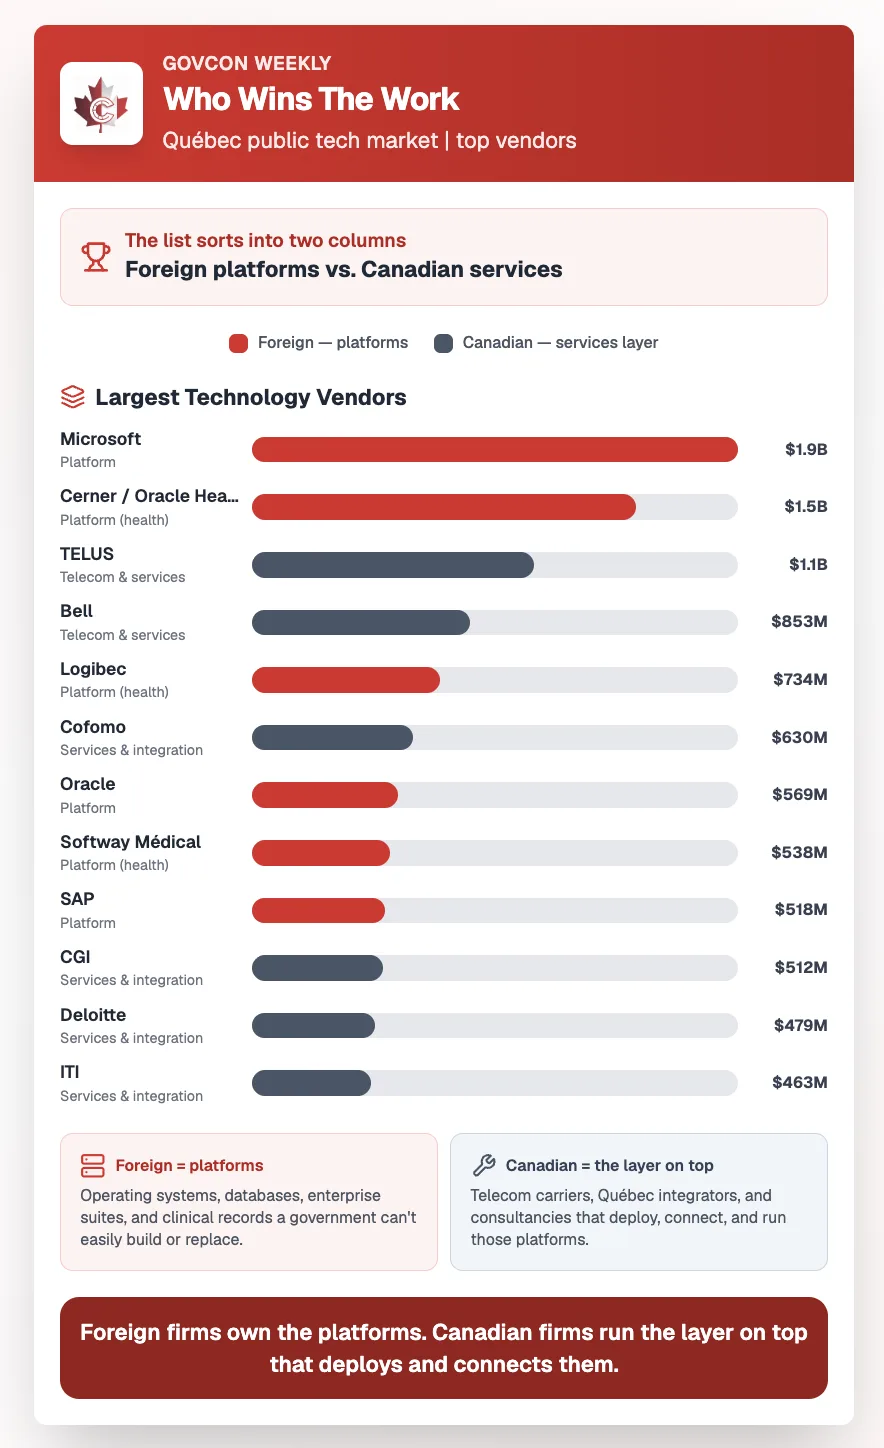
The largest vendors sort almost perfectly into two columns. Microsoft leads at $1.9 billion, followed by Cerner / Oracle Health at $1.5 billion; the largest Canadian names are the telecom carriers TELUS at $1.1 billion and Bell at $852.7 million (award records). The ownership flag on each vendor comes from the Publicus supplier classification.
| Vendor | Technology awards | Ownership | Layer |
|---|---|---|---|
| Microsoft | $1.9B | Foreign | Platform |
| Cerner / Oracle Health | $1.5B | Foreign | Platform (health) |
| TELUS | $1.1B | Canadian | Telecom and services |
| Bell | $852.7M | Canadian | Telecom and services |
| Logibec | $733.7M | Foreign (flagged) | Platform (health) |
| Cofomo | $629.6M | Canadian (QC) | Services and integration |
| Oracle | $569.1M | Foreign | Platform |
| Softway Médical | $537.9M | Foreign | Platform (health) |
| SAP | $518.2M | Foreign | Platform |
| CGI | $512.1M | Canadian (QC) | Services and integration |
| Deloitte | $479.0M | Canadian | Services and integration |
| ITI | $463.2M | Canadian (QC) | Services and integration |
Source: publicly visible awards from SEAO and Quebec municipal records, FY20 to FY26, analysed by Publicus.
The foreign names are platforms: the operating systems, databases, enterprise suites and clinical record systems a government cannot easily build or replace. The Canadian names are the layer on top: the carriers, Quebec integrators and consultancies that deploy, connect and run those platforms. The two are not really competing. Cofomo, CGI and ITI are not up against Microsoft; they are competing for the services budget that Microsoft's presence creates.
Ownership is also a moving target. The classification flags Logibec as foreign despite its Montreal roots, because it follows current corporate ownership rather than where a firm was founded. "Canadian vendor" is not a fixed label, and these numbers track ownership, not heritage (vendor notes).
For a Canadian services firm, the practical conclusion is to stop treating the foreign platforms as competitors and start treating them as terrain. Every dollar the big platforms win in Quebec creates downstream integration and support work that already flows to firms like yours. For a foreign platform the reverse holds: Quebec growth runs through the local integrators who own the buyer relationships.
Why do Quebec public buyers purchase the same software over and over?
Match contract titles to named products and the same technology turns up again and again, bought independently. Microsoft 365 appears in 331 separate contracts across 168 different buyers. VMware shows up across 114 buyers and Fortinet across 118. Across 61 named products, the analysis counts 1,849 of these fragmented buys (contract titles from SEAO open data).
Coordinating them could free roughly $148 million, using the standard 8 to 20 percent benchmark for software licence consolidation. This is not a scandal. It is what happens when a market has a thousand independent buyers and no shared purchasing view. For a vendor it explains why the municipal and education segments feel so scattered: you are not selling to one buyer, you are selling the same thing to a hundred (GovCon Weekly).
Keep that lever in proportion, though. The $148 million is real and worth capturing, but it is a rounding error against $20.4 billion. The bigger prize for the province is managing the platform relationships, not chasing licence overlaps (source).
What are Quebec's new IT procurement rules trying to fix?
In February 2026, Minister of Cybersecurity and Digital Affairs Gilles Bélanger released a policy statement on information technology procurement, paired with more than $1.4 billion in projects meant to reduce reliance on US technology giants. It prioritizes Quebec and Canada-based vendors for major IT contracts, pushes data hosting onto Quebec soil, and favours open-source and custom builds (BetaKit; Ministère de la Cybersécurité et du Numérique). The intent is clear. The data above shows where the lever exists, in services and integration, and where it does not, in the platform layer.
The same month, Commissioner Denis Gallant concluded that the SAAQclic overhaul cost roughly $955 million against early vendor estimates of $141 million to $163 million. His report found a procurement process that did not foster open competition, reporting requirements loosened so overruns escaped central scrutiny, and officials who misled authorities. Its 26 recommendations point to central oversight, stage-gate approvals and real-time reporting for high-risk projects (CBC News).
Read the buyer-segment table as an org chart of where the money sits. Ministries at $7.6 billion and health at $3.9 billion hold most of the technology dollars, so central coordination pays off fastest there, and it is exactly the coordination the Gallant report says was missing. Cloud, at $8.6 billion and rising, is better managed as a recurring liability: renewals handled as a portfolio, not as one-off contracts (analysis).
How do you sell technology to the Quebec government?
- Know which layer you are in. Platform or services decides whether you compete on product or on relationship, and the two motions barely overlap.
- Route by segment. Consulting and integration to ministries, clinical platforms to health, devices to education, and a high-volume, many-doors motion to municipalities.
- Partner with the platforms. The foreign platform layer generates the Canadian services layer. The fastest path into Quebec for a local firm runs alongside the big platforms, not against them.
- Watch the renewals. Cloud contracts recur, so the moment to compete is before a subscription renews, not after (how Publicus tracks buyers and renewals).
About the data
Figures are publicly visible technology awards from Quebec's SEAO system and Quebec municipal records, FY20 to FY26, covering 1,074 public buyers and 13,869 suppliers, with supplier ownership classified by Publicus. Only disclosed values are counted, so every total is a floor: contracts with undisclosed values and purchasing outside the public records are missing, cybersecurity is understated because it is often bundled into larger contracts, and ownership shares cover only suppliers whose owner could be identified. This analysis first appeared in GovCon Weekly on July 14, 2026.
- quebec
- technology procurement
- provincial procurement
- market map
- govcon weekly