Newfoundland and Labrador Government Procurement: Who Buys, Who Wins, and Where the $5.4B Goes
ARTICLE SUMMARY
Newfoundland and Labrador's public sector has awarded at least $5.4 billion in disclosed contracts since 2019: 12,072 awards from 229 public buyers to 3,086 suppliers, based on Public Procurement Agency award reports...
- For
- Vendors, buyers, and readers following Canadian procurement
- Main topic
- Market Maps
- Why it matters
- The article's argument is summarized up front so people and agents can grasp the point before reading the full body.
Newfoundland and Labrador's public sector has awarded at least $5.4 billion in disclosed contracts since 2019: 12,072 awards from 229 public buyers to 3,086 suppliers, based on Public Procurement Agency award reports and provincial portal records. Half of those dollars go to companies based in the province. Roads and civil works are the largest category and almost entirely Canadian-owned; technology is the opposite, at 29 percent Canadian. This page maps who buys, who wins, and where a new supplier can get in.
How big is the Newfoundland and Labrador procurement market?
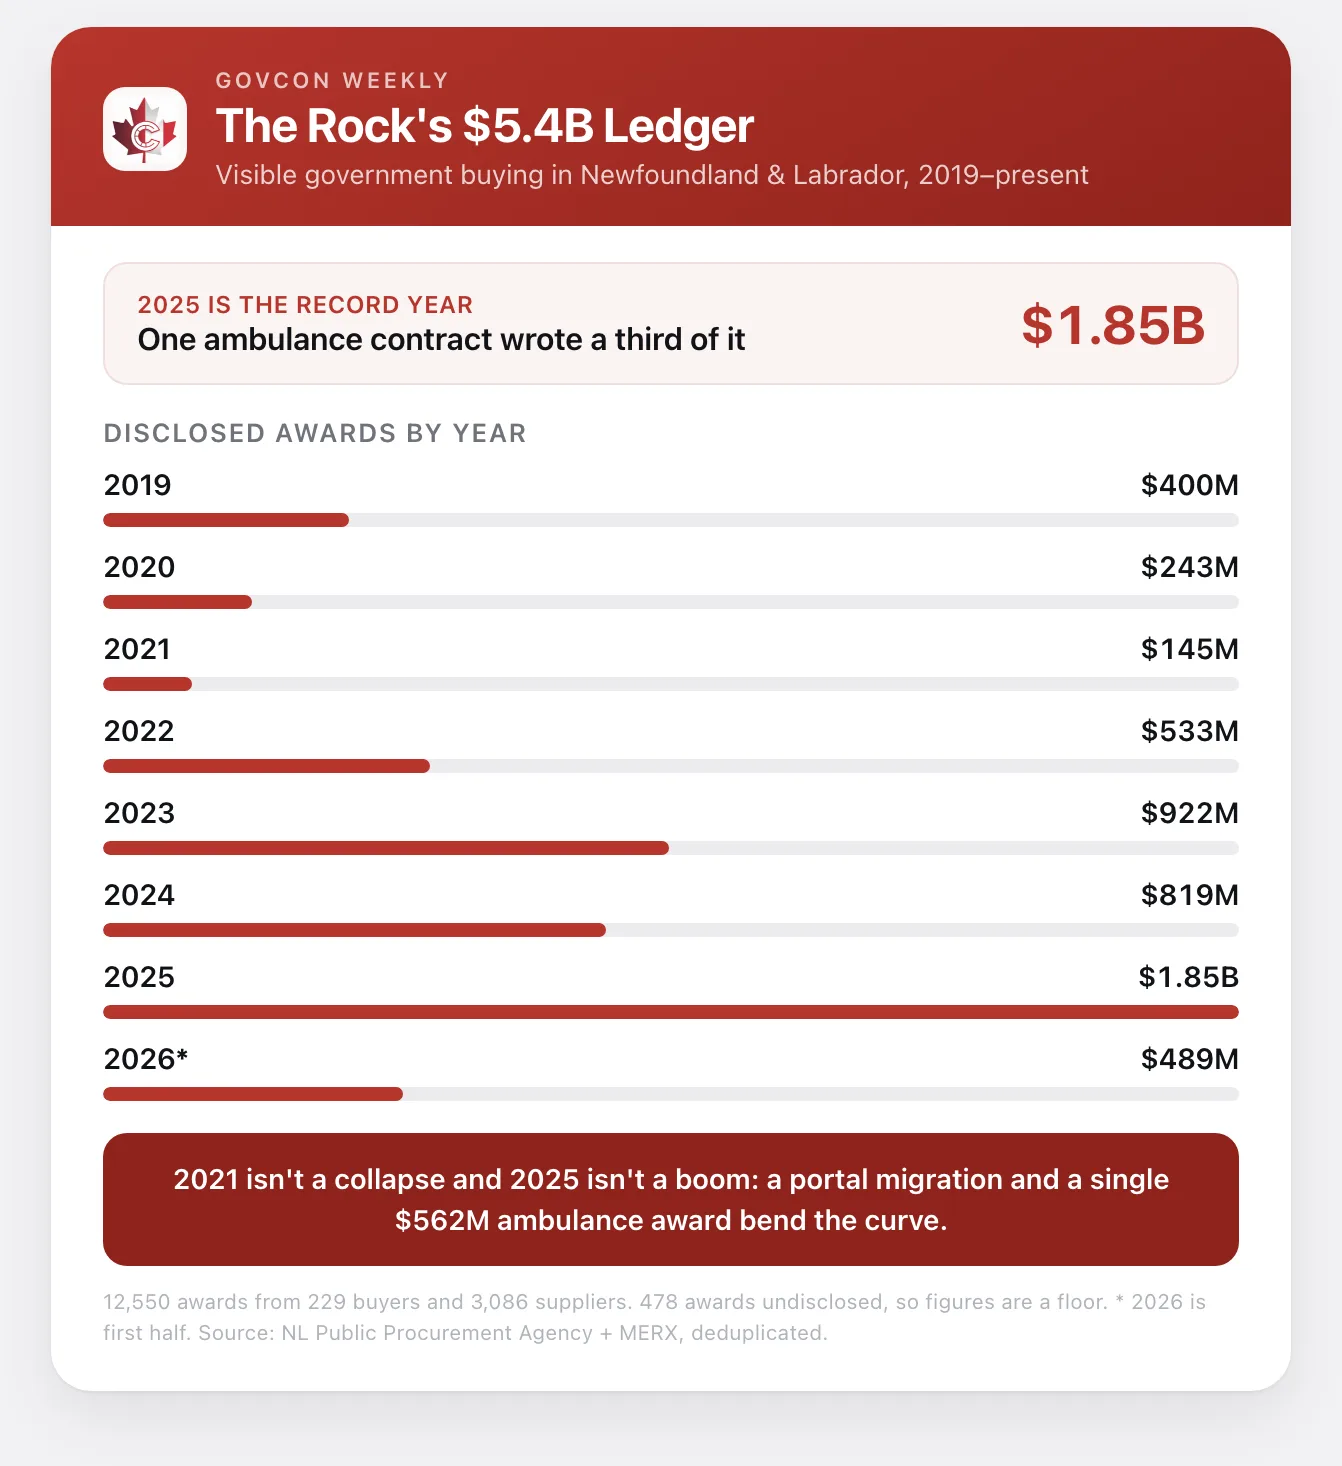
Disclosed awards rose from about $400 million in 2019 to a record $1.85 billion in 2025, according to the Public Procurement Agency's award reporting combined with the province's tendering portal. Two details change how that curve should be read.
The dip in 2021 is a reporting gap, not a cut. The province moved tendering to a new portal that year, and its award reports show the migration rather than the market. Roads make the point: on the agency's reports alone they appear to fall off a cliff in 2021, but across both channels road awards grew from $215 million in 2019 to $335 million in 2025 (full GovCon Weekly analysis).
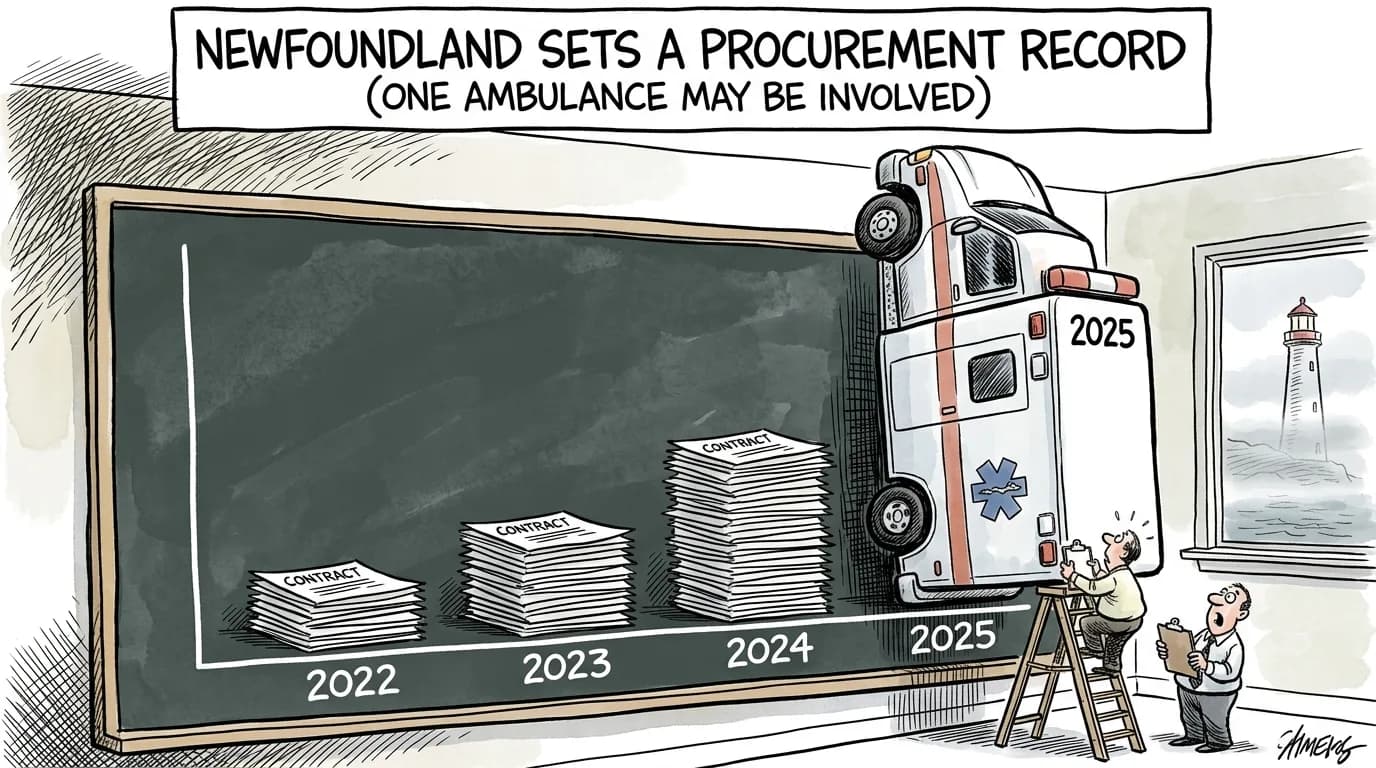
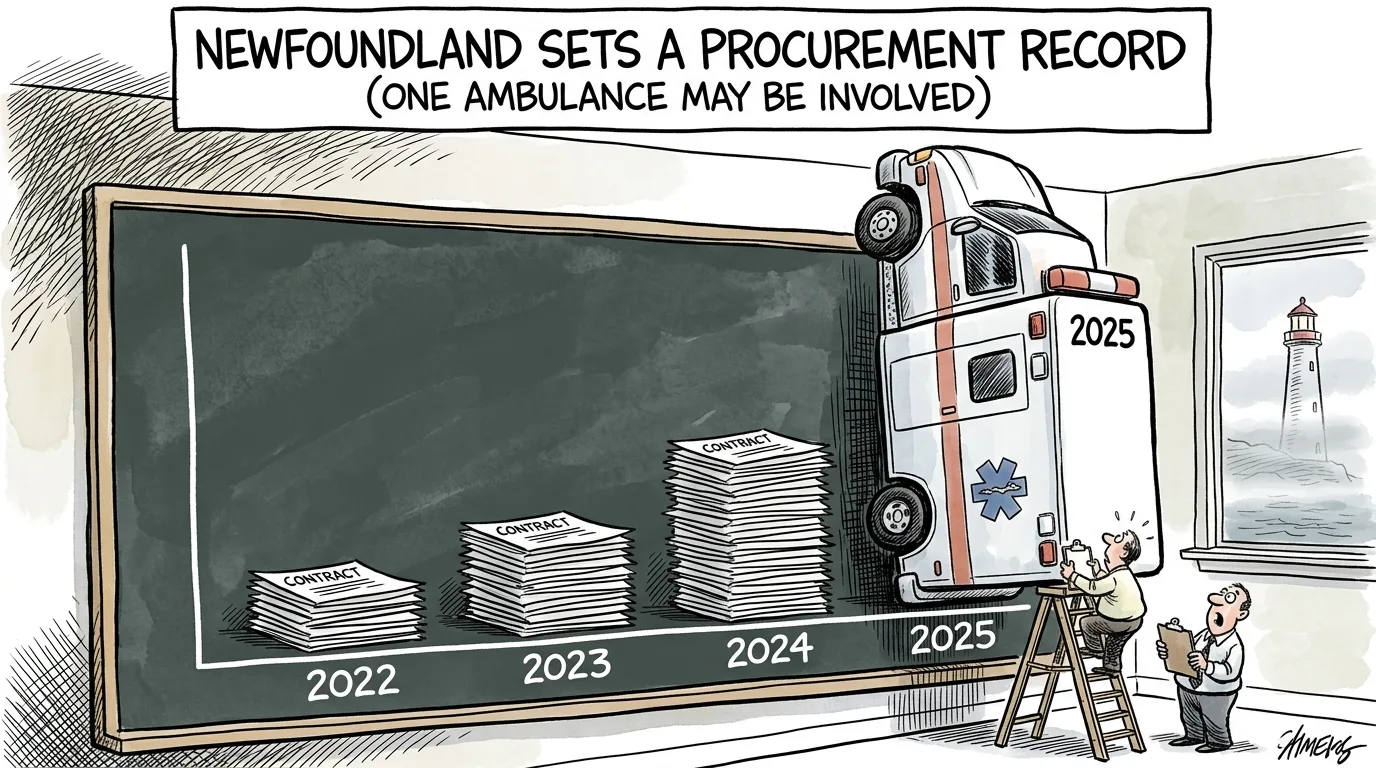
The record 2025 also has an asterisk. A single $561.7 million, ten-year integrated ambulance contract to Medavie Health Services, the largest award in the dataset, accounts for about a third of it. Take it out and 2025 sits on the 2023 and 2024 run rate. In other words, this is a market of roughly $900 million a year with one exceptional contract on top (award data).
What does the province buy?
The Canadian-owned share swings more by category than any other measure here. Anything that is poured, paved, welded or driven is bought from Canadian firms, mostly local ones. Anything that arrives in a box or a browser is not. The table below uses disclosed award values; the last column is the share of dollars won by Canadian-owned companies.
| Category | Awarded | Share of market | Canadian-owned share |
|---|---|---|---|
| Roads and civil infrastructure | $1.69B | 31.3% | 98% |
| Health services | $724.4M | 13.4% | 93% |
| Buildings and vertical construction | $520.9M | 9.6% | 93% |
| Facilities and building services | $320.7M | 5.9% | 80% |
| Software and SaaS | $301.3M | 5.6% | 15% |
| Energy and utilities | $280.7M | 5.2% | 67% |
| Vehicles and mobile equipment | $262.8M | 4.9% | 96% |
| Office supplies and furniture | $240.5M | 4.5% | 3% |
| Marine and aviation | $210.5M | 3.9% | 84% |
| Medical equipment and supplies | $200.1M | 3.7% | 9% |
| Professional services | $148.6M | 2.8% | 75% |
Source: NL Public Procurement Agency award reports and provincial portal records, 2019 to mid-2026, analysed by Publicus.
The office supplies line is almost entirely one set of paper standing offers to Domtar, operating as Ariva, published with a ceiling of about $205 million. The pattern that matters for policy is the gap between construction, where local content is effectively solved, and technology and medical supplies, where Canadian firms win under 15 percent of the dollars. If Buy Canadian rules reach provincial buying, that gap is where the pressure lands (Canadian procurement trends).
Who are the biggest buyers?
The Department of Transportation and Infrastructure buys more than the next four buyers combined: $1.53 billion since 2019, or roughly 28 cents of every visible procurement dollar in the province (source). NL Health Services is second at $979 million and is also the buyer behind most technology purchasing. Crown corporations add about $408 million, led by Newfoundland and Labrador Hydro.
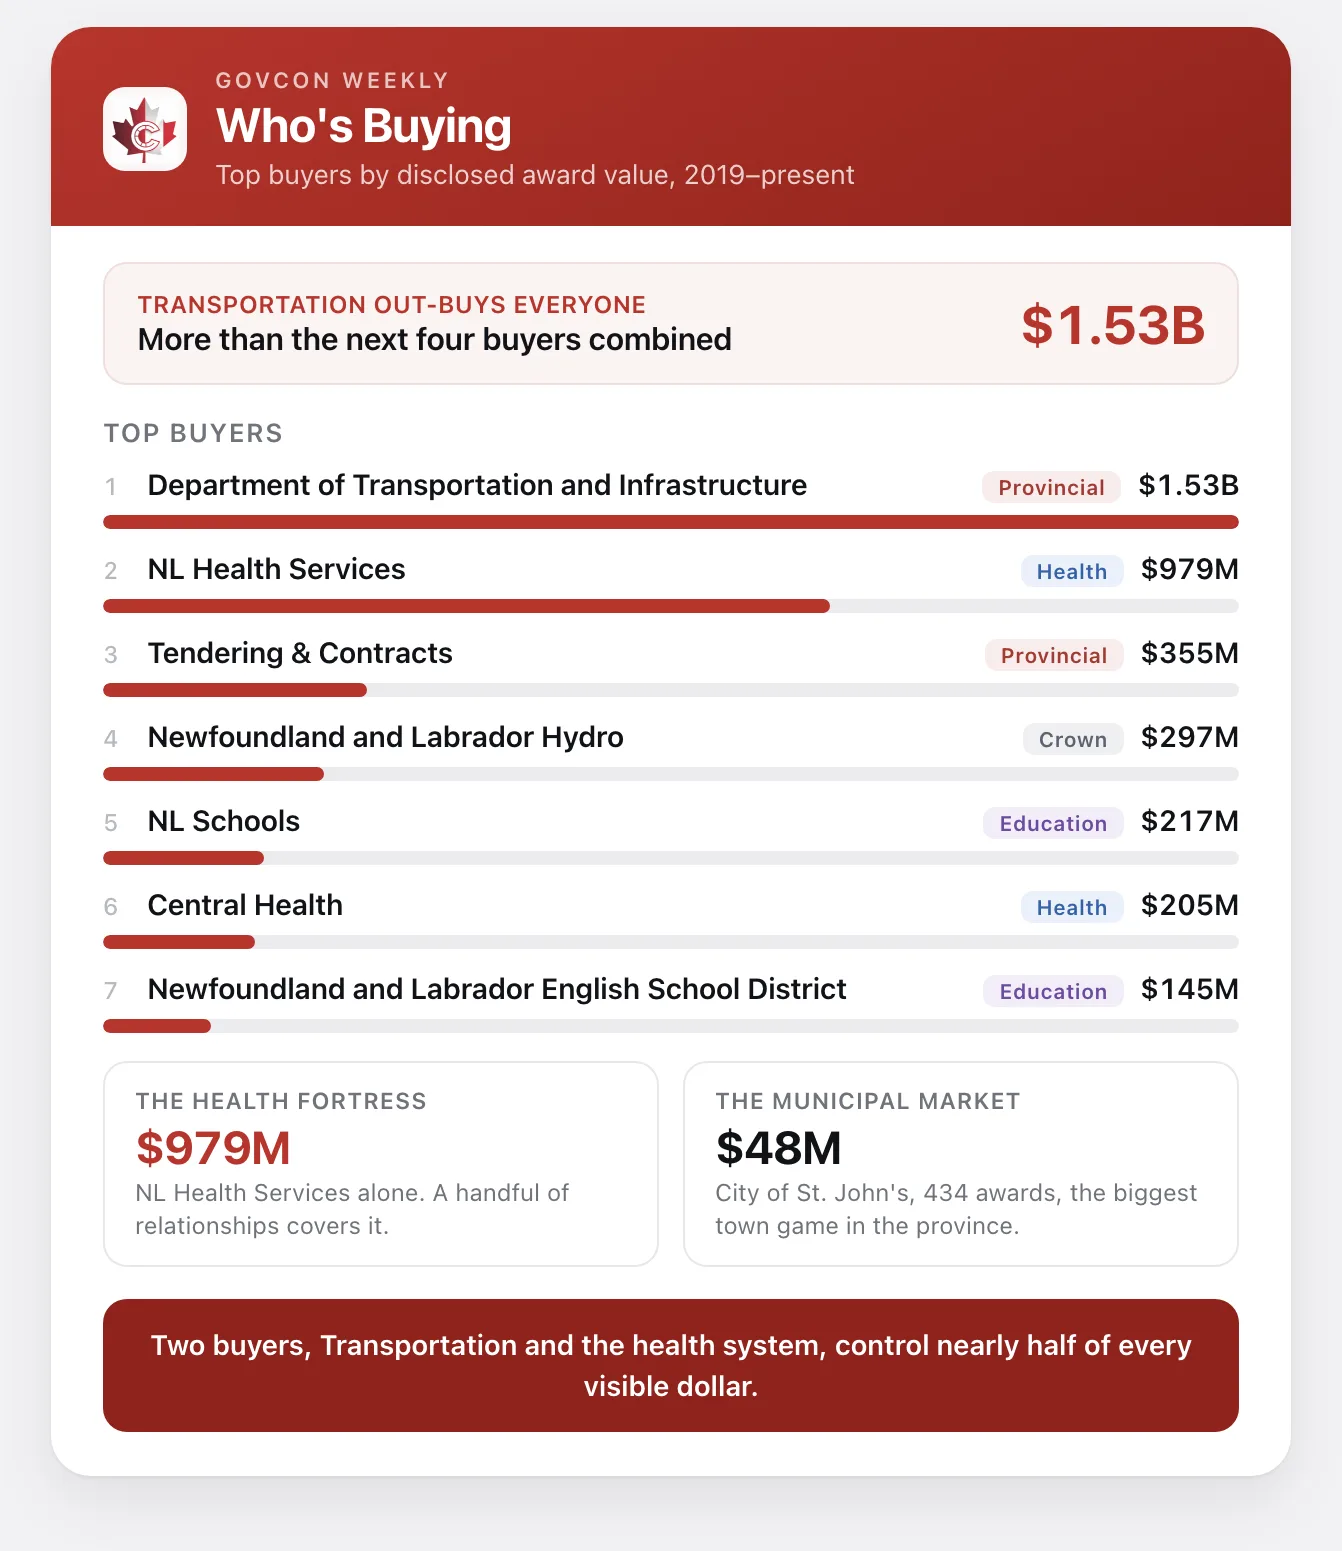
Municipal buying is the least visible part of the market. About $304.5 million flows through provincial portals, led by the City of St. John's, but most towns buy directly, so that figure is a floor rather than a total (method notes).
Who wins Newfoundland and Labrador government contracts?
Fifteen vendors, out of 3,086, take about 43 percent of disclosed dollars. Most of the leaderboard is Newfoundland heavy-civil firms such as Farrell's Excavating, J-1 Contracting and JCL Investments; the only technology name near the top is Microsoft (vendor rankings). Two of the larger totals, the Domtar paper offers and a $110.4 million plumbing and heating award in Happy Valley-Goose Bay, are standing-offer ceilings, so they show the most the province could buy under them rather than confirmed purchases.
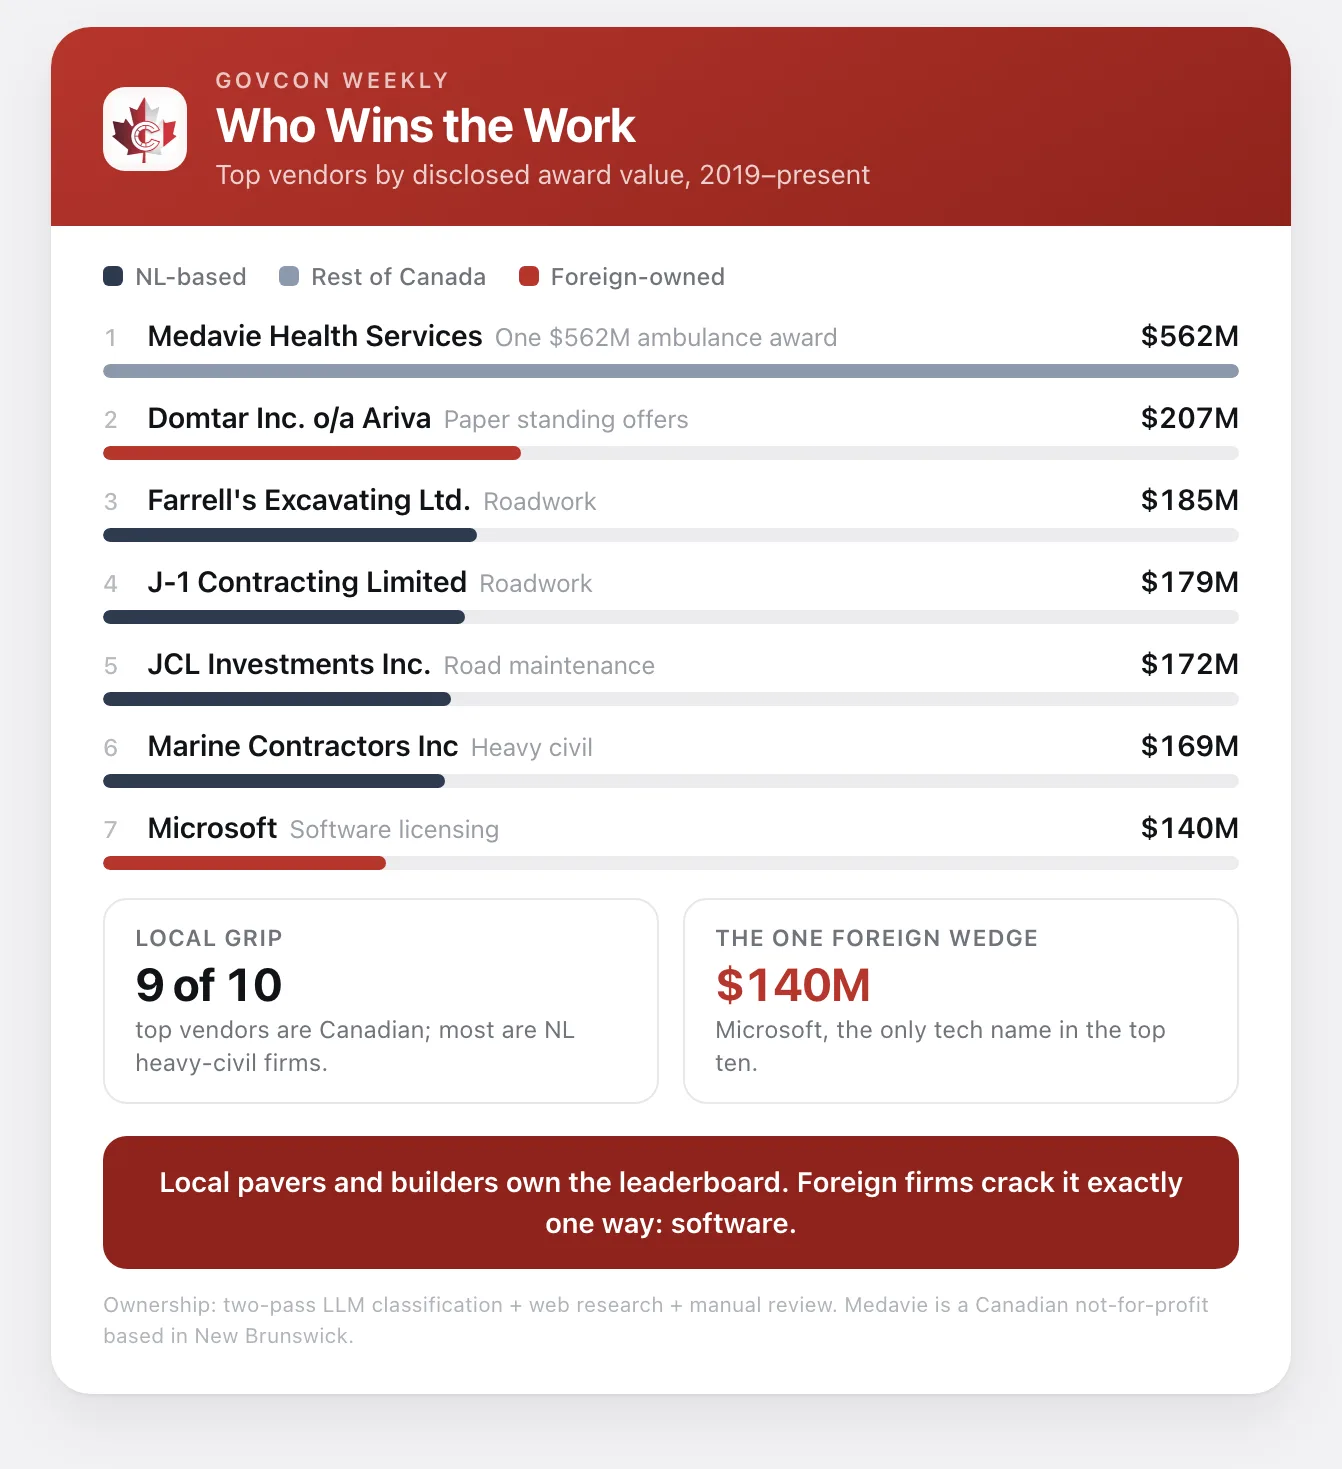
How concentrated a category is should decide whether you bid at all. In health services the top vendor holds 78 percent of the dollars and the top five hold 96 percent; in office supplies the top vendor holds 86 percent. Roads, the biggest category, is the most open: the leading firm has 11 percent and dozens of contractors win meaningful work every year (concentration table).
How much of the money stays in the province?
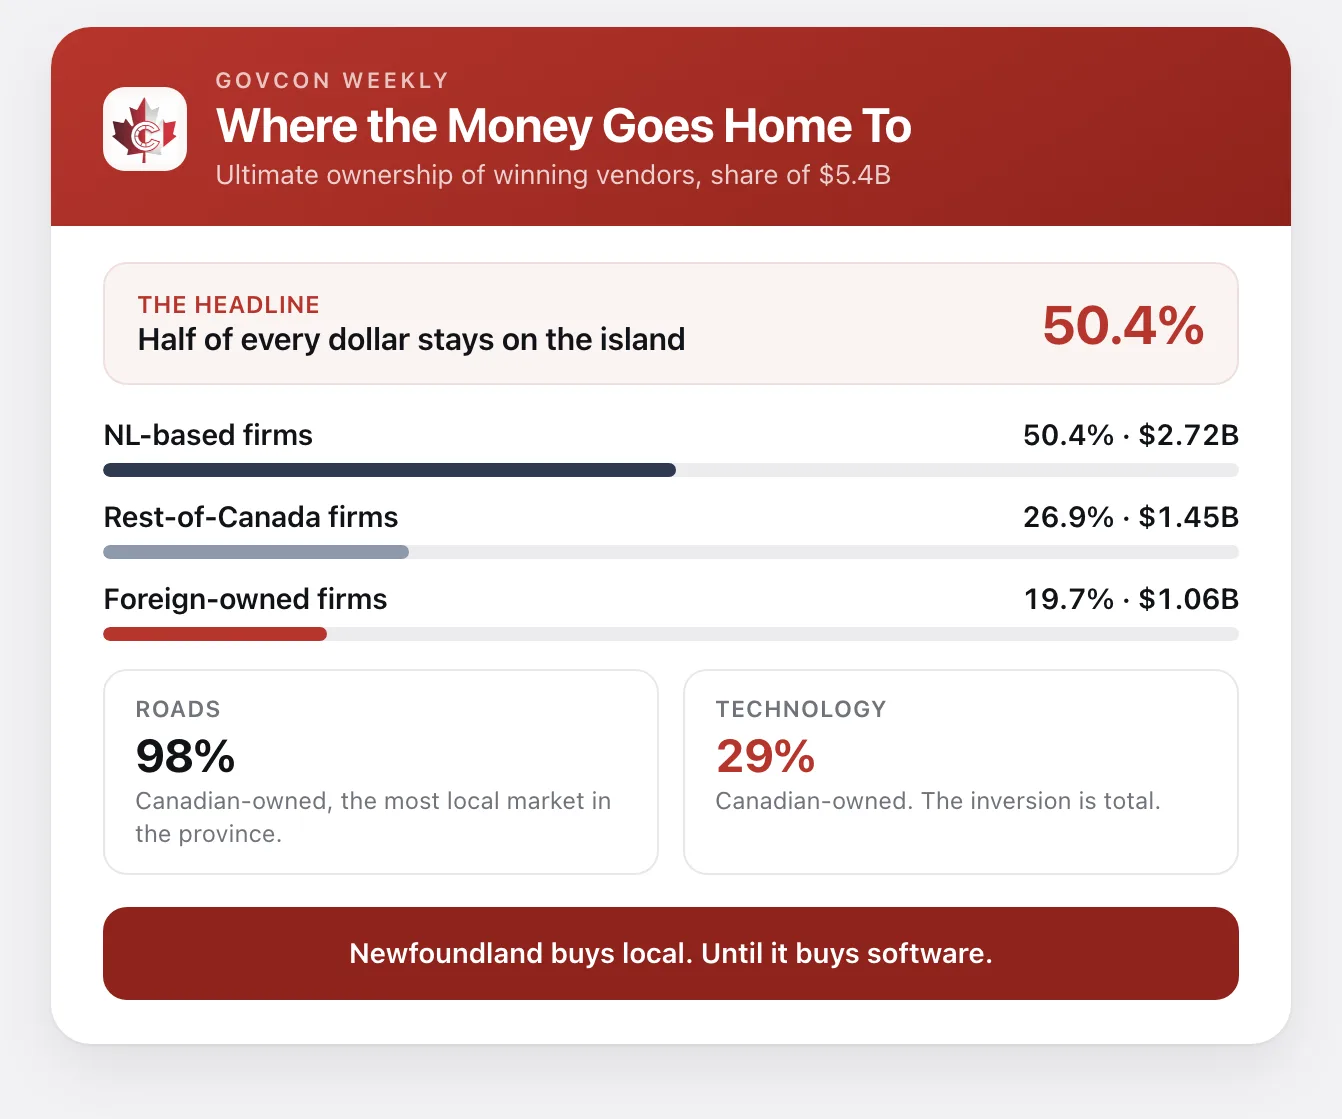
About 50.4 percent of disclosed dollars, $2.72 billion, goes to companies based in Newfoundland and Labrador. Another 26.9 percent goes to firms elsewhere in Canada, and 19.7 percent to foreign-owned firms. For a province of roughly 540,000 people (Statistics Canada), that is one of the strongest local retention rates we have measured, achieved without a formal local preference in most categories.
Technology procurement in Newfoundland and Labrador
Technology, meaning software, hardware, IT services and telecom, totals $442.4 million since 2019, about 8 percent of the market (award data). Software and SaaS is $301.3 million of that. The buyers are concentrated in health: NL Health Services, the NL Centre for Health Information and Central Health together account for about 54 percent of technology dollars, and reported technology purchasing tripled between 2022 and 2023, almost entirely on health-system licensing.
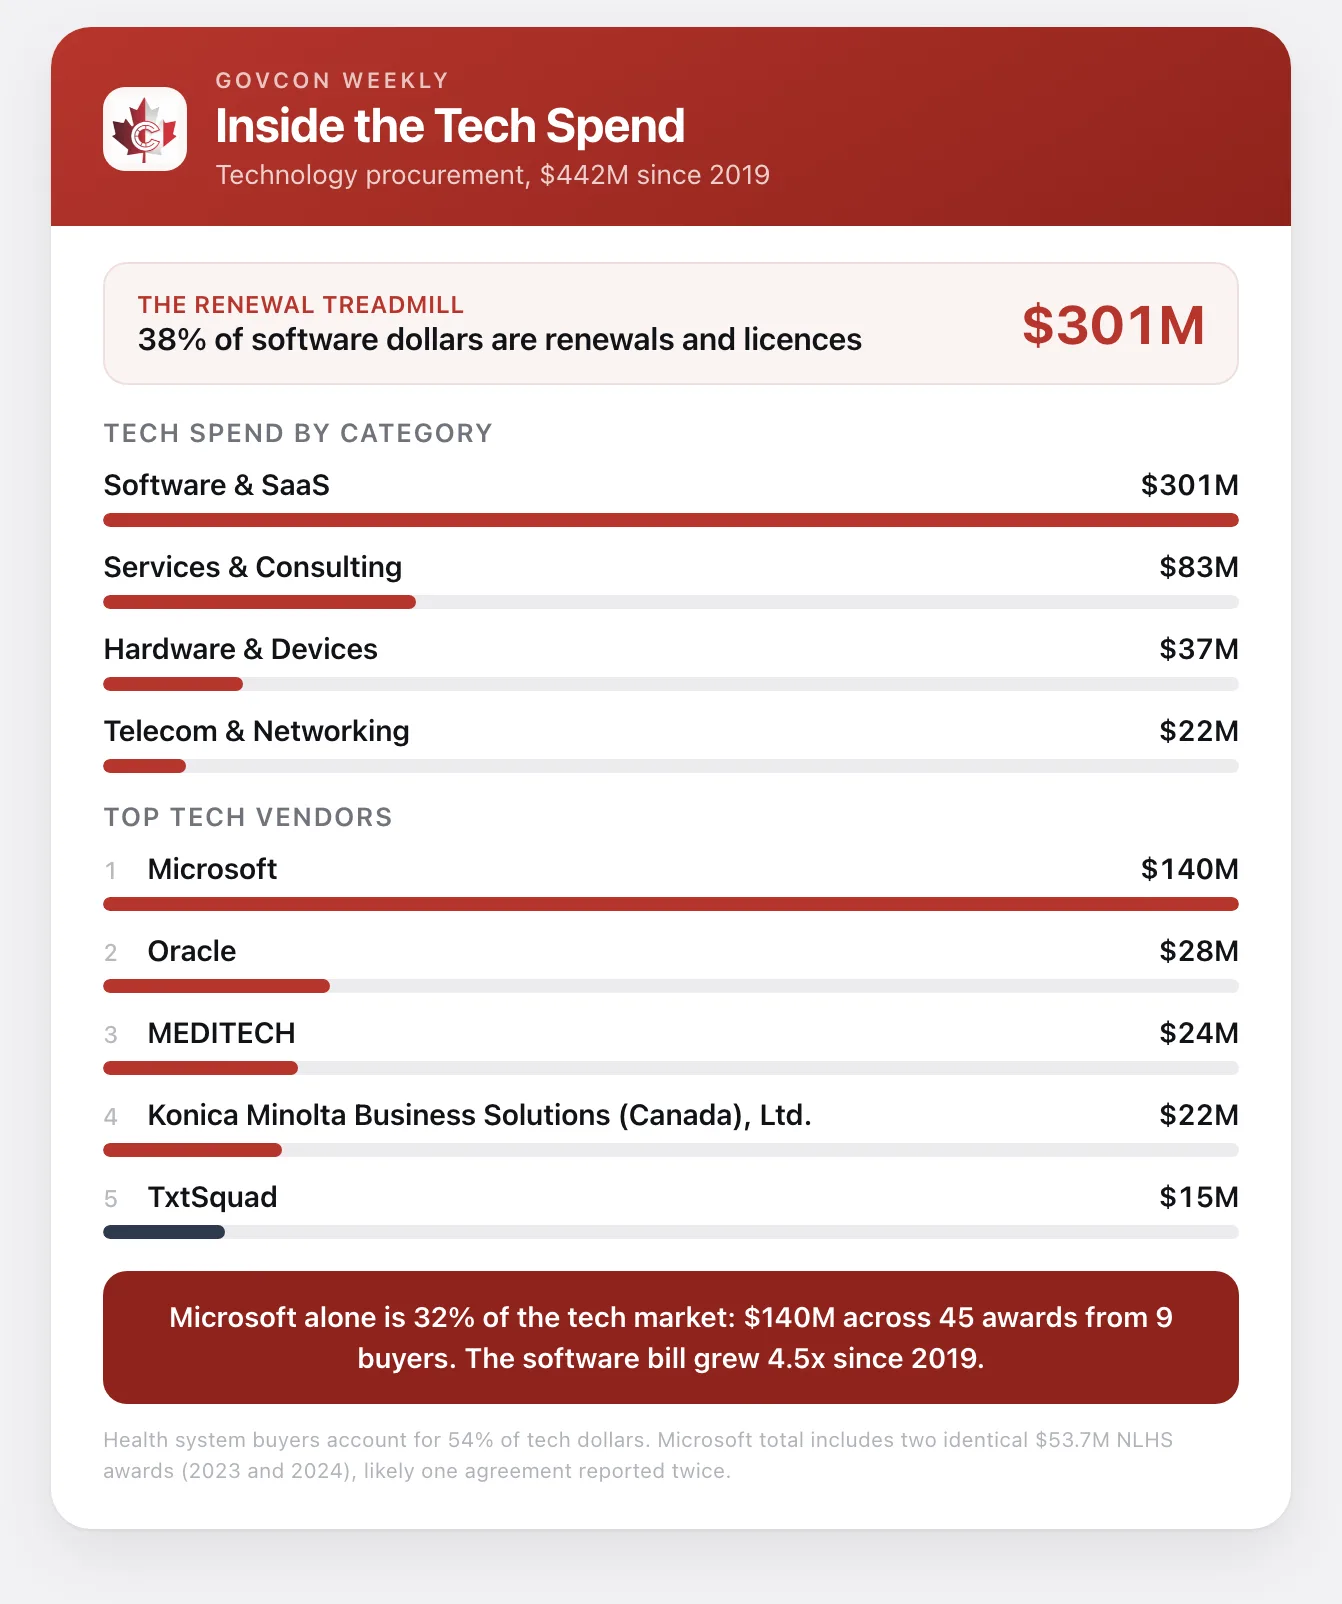
Much of that money renews what is already installed. Microsoft holds $140.6 million across 45 awards from 9 buyers, Oracle $27.7 million across 45 awards from 10 buyers, and MEDITECH $23.7 million across 10 awards. Renewal, subscription or licence language appears in 392 software awards worth $113.4 million, about 38 percent of software dollars (renewal analysis). One caveat travels with the Microsoft total: two identical $53.7 million NL Health Services awards in 2023 and 2024 look like one agreement reported twice.
For a challenger, renewals are the map. Each one has a date, and a vendor who arrives a year early with a credible alternative is competing against a calendar. Canadian firms hold 29 percent of technology dollars, so every point of share is worth roughly $4.4 million. TxtSquad, a Canadian messaging platform with $15.4 million in NL Health Services awards, shows the health system will buy Canadian when the product fits (award records).
How to win a first contract in Newfoundland and Labrador
The median disclosed award is $49,172. Two-thirds of contracts are under $100,000, though they carry only 5 percent of the dollars, while the 7 percent of awards over $1 million carry 77 percent (award size distribution). Repeat vendors take 80.6 percent of the money, so the first small award is worth more than its value suggests.
- Civil contractors: roads is the rare large category that rewards newcomers, with no single firm above 11 percent.
- Software vendors: build a renewal calendar for the health system's Microsoft, Oracle and MEDITECH agreements and arrive before the decision, not at the tender.
- Firms new to government: target the under-$100,000 lane with the goal of becoming a repeat vendor; the second award is far easier than the first (how Publicus tracks this).
- Municipal suppliers: treat the portal figure as the visible tip. St. John's and Gander post consistently; most towns buy directly.
About the data
Figures combine NL Public Procurement Agency award reports with the province's tendering portal records from 2019 to mid-2026, deduplicated across the two sources, with the ownership of nearly 4,000 suppliers classified by Publicus. Only disclosed values are counted, so every total is a floor: 478 awards published no value, some portal values are standing-offer ceilings, 2021 under-reports because of the portal migration, and 2026 covers about half a year. This analysis first appeared in GovCon Weekly on July 21, 2026.
- newfoundland and labrador
- provincial procurement
- market map
- govcon weekly