British Columbia Capital Projects and Municipal Procurement: $38B in Capital, $4.6B in City Contracts
ARTICLE SUMMARY
British Columbia's Budget 2026 commits nearly $38 billion in taxpayer-supported capital over three years, for hospitals, schools, transit and student housing, even as the province cuts 15,000 public sector positions (...
- For
- Vendors, buyers, and readers following Canadian procurement
- Main topic
- Market Maps
- Why it matters
- The article's argument is summarized up front so people and agents can grasp the point before reading the full body.
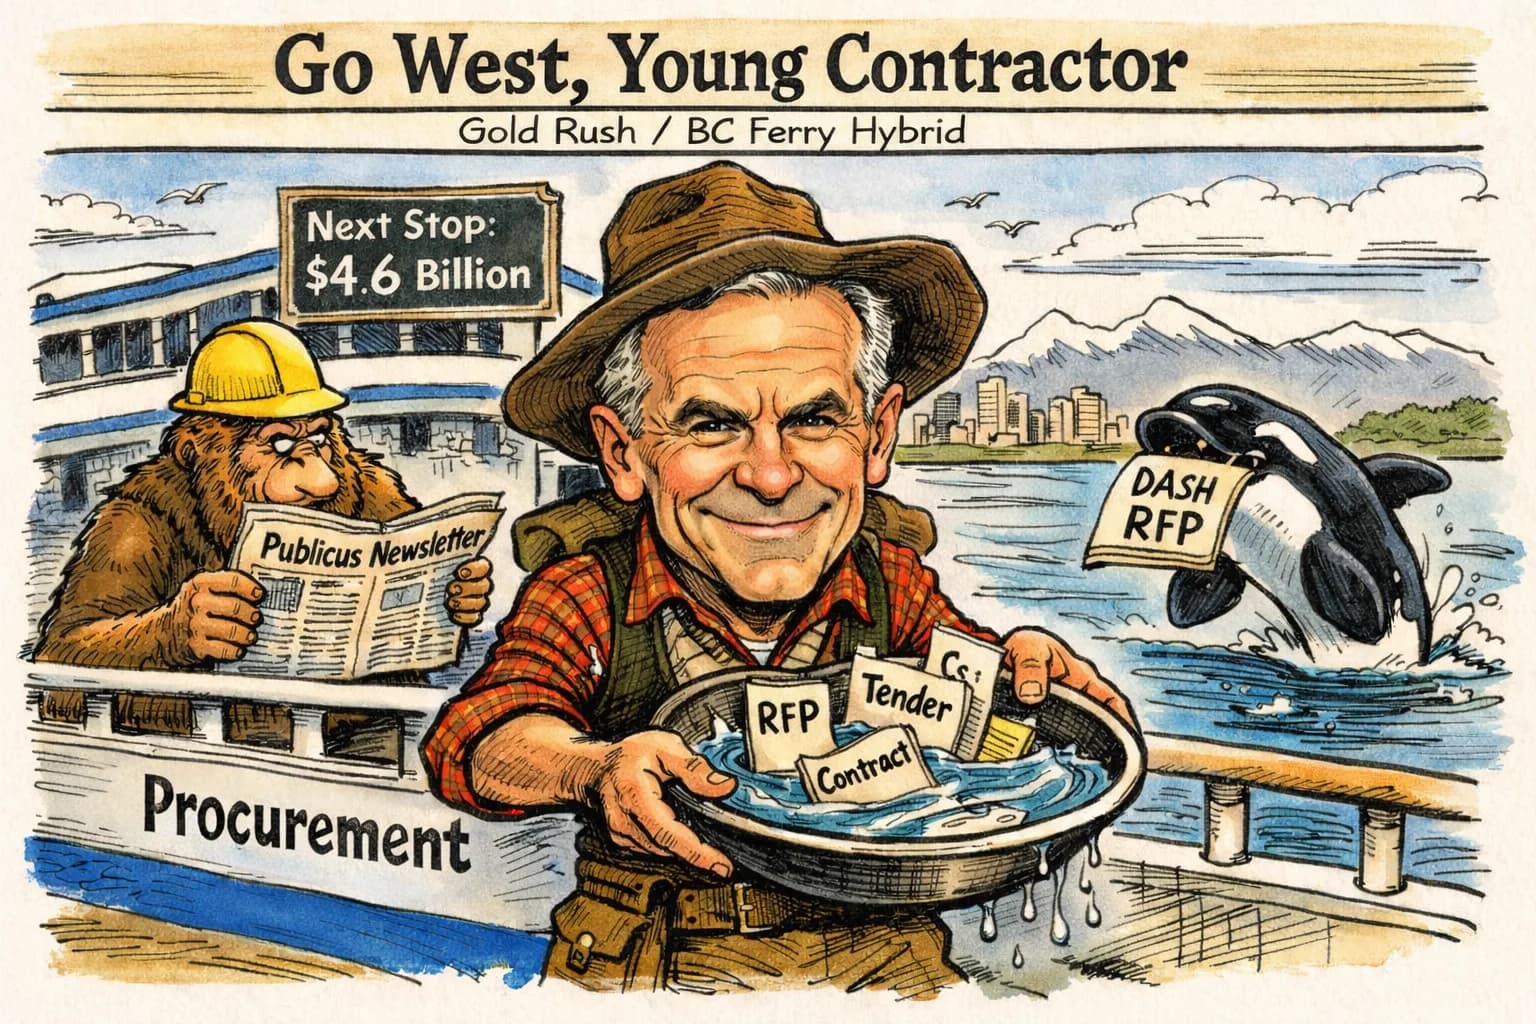
British Columbia's Budget 2026 commits nearly $38 billion in taxpayer-supported capital over three years, for hospitals, schools, transit and student housing, even as the province cuts 15,000 public sector positions (B.C. Government News). Underneath sits a $4.6 billion municipal contract market that is one of the most competitive in Canada: 3,907 vendors, and the top five hold 9.8 percent of the value. This page maps where that money goes and who wins it.
What is in British Columbia's capital plan?
Budget 2026 pairs restraint on operations with investment in buildings. The headline numbers are $13.3 billion in projected deficits and a plan to cut 15,000 public sector FTEs, but the capital plan is where contractors should be looking (budget release, Budget 2026 documents). The nearly $38 billion over three years covers:
- Health: 17 major hospital projects.
- Education: 66 K-12 school projects and 3,900 new student housing beds.
- Transit: expansions including the Broadway Subway and the Surrey Langley SkyTrain.
Provincial tenders for this work are posted on BC Bid, the province's official procurement portal. Historically, the second quarter has been the richest for major awards, so the relationships that matter are built before spring, not during it (GovCon Weekly analysis).
What does Budget 2026 change for government suppliers?
Several measures affect how suppliers price and plan, beyond the capital list itself (source):
- A new $400 million Strategic Investments fund aimed at fast-moving federal partnership opportunities in clean energy, sustainable forestry, responsible mining and clean tech.
- $283 million for skilled trades training, including a plan to double apprenticeship seats by 2028-29, with the BC Employer Training Grant expanding to match.
- A temporary 15 percent Manufacturing and Processing Investment Tax Credit for buildings, machinery and equipment, and an extension of the Shipbuilding and Ship Repair Tax Credit through 2027.
- PST expanding to professional services, including accounting, architectural, engineering and security services.
The other side of the budget is the 15,000 FTE reduction and $3.5 billion in expenditure management savings. Expect consulting and professional services contracts to face more scrutiny, and discretionary work to get harder to justify. If you sell engineering, architecture, accounting or security services to government, the PST change belongs in your pricing model before your next bid (Budget 2026).
How big is the B.C. municipal procurement market?
Publicus pulled municipal contract data from four source portals for 2019 to 2025. It covers 51 of B.C.'s 174 municipalities and regional bodies (full analysis).
| Metric | Value |
|---|---|
| Total contracts | 7,301 |
| Total value | $4.6B |
| Municipalities covered | 51 of 174 |
| Unique vendors | 3,907 |
| Median contract | $222K |
| Top 5 vendor share | 9.8% |
| Market concentration (HHI) | 67 (unconcentrated) |
Source: B.C. municipal contract records from four source portals, 2019 to 2025, analysed by Publicus (GovCon Weekly).
The median contract is $222,000: a small number of large contracts carry much of the value, while most municipal buying happens well below the million-dollar mark. If you are a small or mid-sized contractor who assumed municipal work was out of reach, the median says otherwise (source).
The Herfindahl-Hirschman Index of 67 is remarkably low. Anything below 1,500 is considered unconcentrated, and below 100 the market is essentially wide open. Federal defence procurement, by comparison, looks like a cozy dinner party (concentration analysis).
| Segment | Vendors | Share of total value |
|---|---|---|
| Top 1% | 39 | 43.3% |
| Top 5% | 195 | 77.3% |
| Top 10% | 390 | 87.8% |
| Top 20% | 781 | 95.3% |
Source: B.C. municipal contract records from four source portals, 2019 to 2025, analysed by Publicus (GovCon Weekly).
Yes, 39 vendors capture 43 percent of the value. But 195 vendors capture 77 percent, which means mid-tier firms can build a significant municipal practice without cracking the top ten (source).
Which B.C. municipalities award the most contracts?
Vancouver and Kelowna together account for roughly 74 percent of tracked municipal value, and they buy in very different ways. The City of Vancouver spreads $2.0 billion across 2,914 contracts and 1,751 vendors. The City of Kelowna concentrates $1.4 billion into 468 contracts with 299 vendors. For a larger firm chasing bigger individual contracts, Kelowna punches absurdly above its population weight.
| Municipality | Total value | Contracts | Top vendor |
|---|---|---|---|
| City of Vancouver | $2.0B | 2,914 | BD Hall Constructors |
| City of Kelowna | $1.4B | 468 | WSP Canada |
| Metro Vancouver | $223.4M | 723 | Hall Constructors |
| City of Burnaby | $205.3M | 430 | Canadian Turner Construction |
| City of Richmond | $183.2M | 518 | Wilco Civil |
| City of Prince George | $110.3M | 401 | Amrize Canada |
| City of Delta | $80.7M | 296 | GPM Civil Contracting |
| City of Nanaimo | $79.7M | 326 | Windley Contracting |
| Capital Regional District | $53.3M | 21 | Windley Contracting |
| District of Summerland | $51.2M | 105 | Okanagan Civil Constructors |
Source: B.C. municipal contract records from four source portals, 2019 to 2025, analysed by Publicus (GovCon Weekly).
The drop after the top two is steep: Metro Vancouver, at $223 million, is a distant third. Dollar rankings also hide some of the busiest buyers. The Township of Langley awarded 411 contracts to 288 vendors, but its records carry no dollar values, so it never appears in value rankings. Ignore it and you miss one of the most active buyers in the province. Abbotsford (143 contracts), the Regional District of Central Okanagan (80) and Kamloops (69) also buy more often than the attention they get suggests (contract counts).
What do B.C. municipalities buy?
Construction and engineering together account for 73 percent of value, $3.3 billion of the $4.6 billion. Professional services leads by contract count, with 876, despite ranking seventh by value. That is the high-frequency, lower-dollar lane where municipalities buy constantly, and if your business works in the $100,000 to $200,000 range, it is where the volume lives (domain analysis).
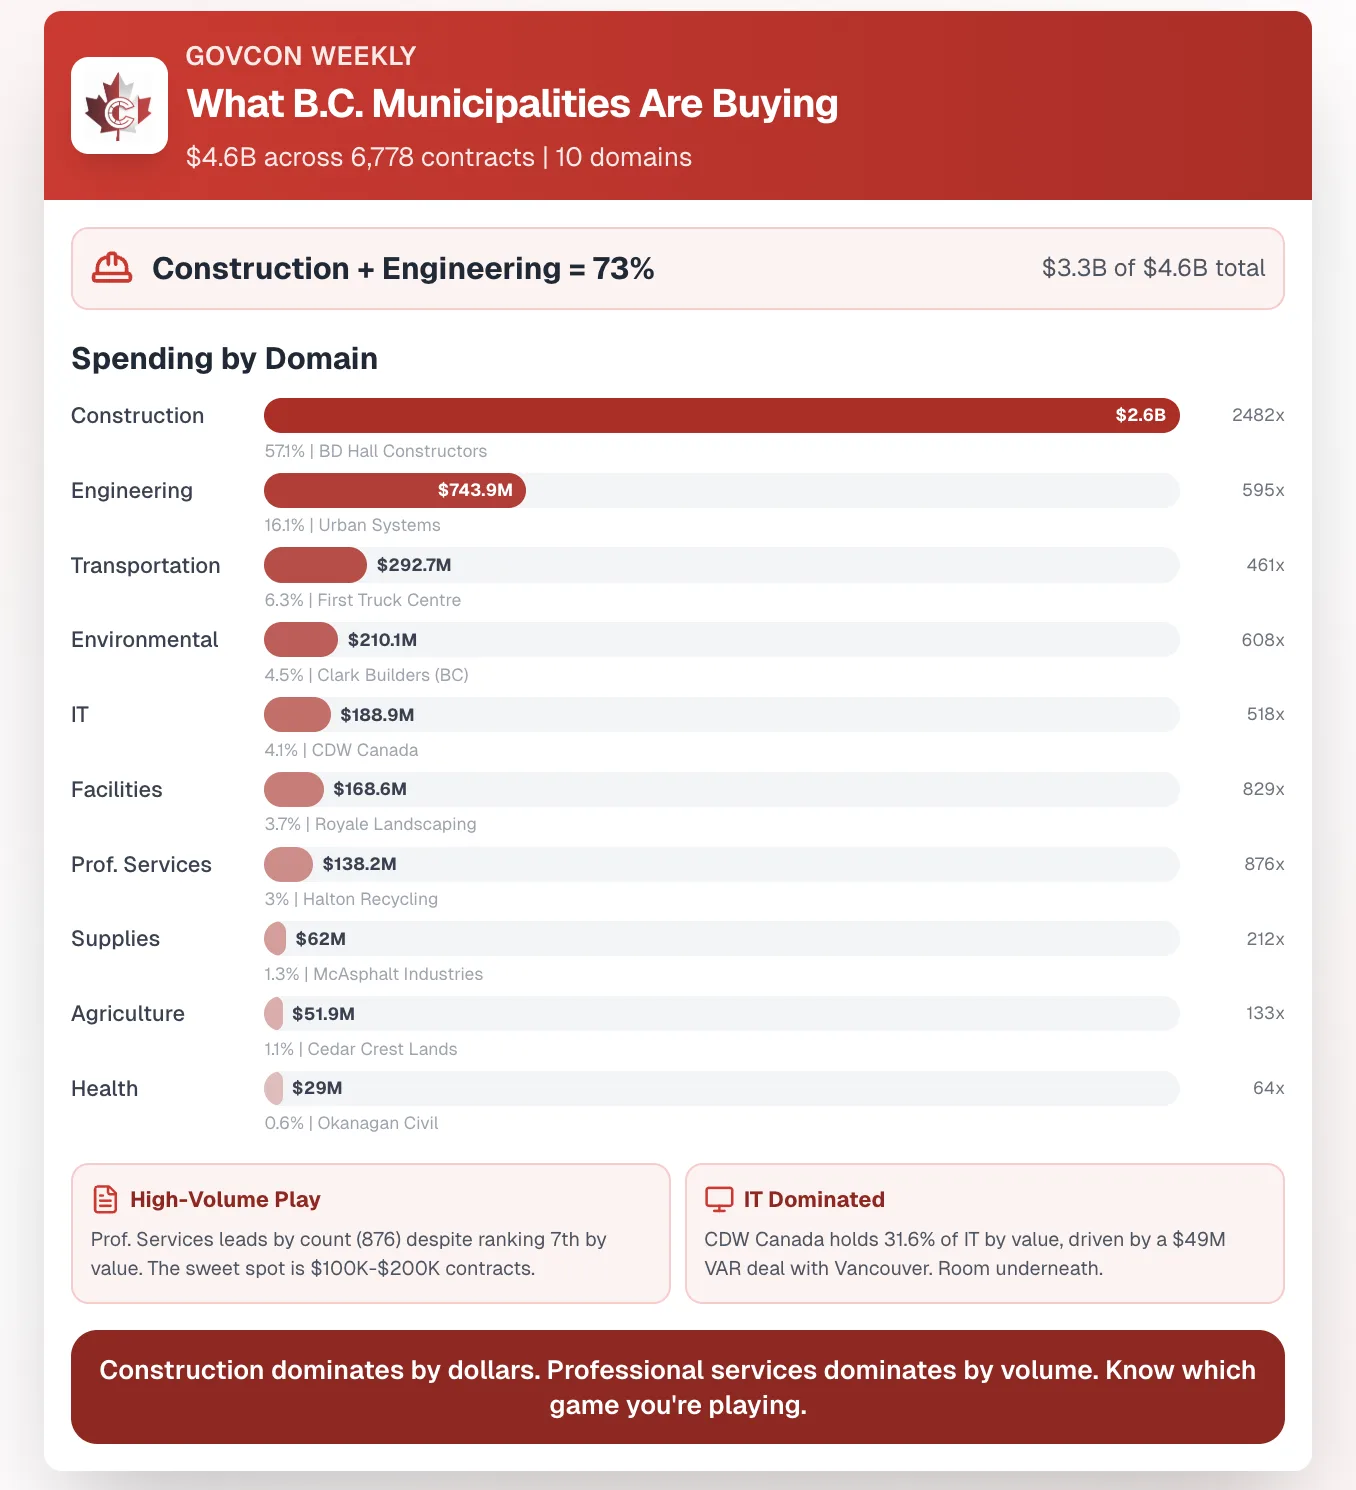
By sub-category, general construction ($1.2 billion) and infrastructure ($1.0 billion) lead. Infrastructure and civil work, meaning water mains, roads, bridges and utility projects, is the core of municipal capital work and the part of the market the provincial capital plan will keep feeding (Budget 2026).
| Sub-category | Contracts | Total value |
|---|---|---|
| General construction | 1,192 | $1.2B |
| Infrastructure | 900 | $1.0B |
| Civil | 509 | $733.0M |
| Plumbing and mechanical | 146 | $316.4M |
| Vehicles | 357 | $270.2M |
| Management services | 790 | $131.3M |
| Building | 584 | $114.6M |
| Assessment and consulting | 252 | $104.8M |
| Cloud and IT services | 217 | $80.1M |
| Waste management | 148 | $74.3M |
Source: B.C. municipal contract records from four source portals, 2019 to 2025, analysed by Publicus (GovCon Weekly).
Which categories are open, and which have a leading vendor?
Concentration varies a lot by domain. In the table, CR1 is the top vendor's share of value and CR4 is the top four vendors' combined share (source).
| Domain | Value | HHI | CR1 | CR4 | Market type |
|---|---|---|---|---|---|
| Construction | $2.6B | 117 | 4.0% | 13.2% | Open |
| Facilities | $168.6M | 168 | 6.7% | 18.5% | Open |
| Agriculture and forestry | $51.9M | 363 | 9.5% | 30.2% | Open |
| Professional services | $138.2M | 421 | 15.2% | 32.9% | Open |
| Supplies | $62.0M | 505 | 10.2% | 35.2% | Open |
| Engineering | $743.9M | 601 | 11.0% | 37.6% | Open |
| Environmental | $210.1M | 723 | 23.3% | 38.1% | Leading players |
| Transportation | $292.7M | 882 | 17.7% | 56.0% | Leading players |
| Health | $29.0M | 1,180 | 19.4% | 63.6% | Leading players |
| IT | $188.9M | 1,238 | 31.6% | 53.6% | Leading players |
| Safety | $11.5M | 1,353 | 31.3% | 58.0% | Leading players |
Source: B.C. municipal contract records from four source portals, 2019 to 2025, analysed by Publicus (GovCon Weekly).
Construction is wide open. The top vendor holds 4 percent of a $2.6 billion market and the top four together hold 13.2 percent. For a domain that size, that is about as competitive as public procurement gets (source).
IT is the most concentrated major domain. CDW Canada alone holds 31.6 percent of the $188.9 million, driven largely by a single $49 million value-added reseller agreement with Vancouver, and the top four hold 53.6 percent. Municipal IT has one dominant player and a lot of room for competitors underneath it. Transportation looks similar: First Truck Centre (17.7 percent), Dueck Auto Group (14.7 percent) and Metro Motors (14.7 percent) hold nearly half the domain, largely on the strength of Vancouver's fleet supply contracts (City of Vancouver buyer profile).
Who wins B.C. municipal contracts?
The top three vendors in the three domains contractors ask about most show how differently each market is built (vendor rankings).
| Domain | Vendor | Value | Share | Contracts |
|---|---|---|---|---|
| Construction ($2.6B) | BD Hall Constructors | $106.0M | 4.0% | 14 |
| Construction ($2.6B) | Heatherbrae Builders | $89.9M | 3.4% | 10 |
| Construction ($2.6B) | Jacob Bros. Construction | $80.3M | 3.0% | 20 |
| Engineering ($743.9M) | Urban Systems | $81.5M | 11.0% | 8 |
| Engineering ($743.9M) | McElhanney | $71.8M | 9.7% | 7 |
| Engineering ($743.9M) | WSP Canada | $64.0M | 8.6% | 7 |
| IT ($188.9M) | CDW Canada | $59.7M | 31.6% | 3 |
| IT ($188.9M) | Microserve | $23.3M | 12.3% | 2 |
| IT ($188.9M) | CGL Contracting | $10.5M | 5.6% | 2 |
Source: B.C. municipal contract records from four source portals, 2019 to 2025, analysed by Publicus (GovCon Weekly).
Engineering is the domain worth studying. Three firms hold nearly 30 percent of a $744 million market, but they do it through relatively few high-value contracts. The rest is fragmented across hundreds of smaller engagements. If you are not going head to head with Urban Systems on a $25 million Kelowna panel, there is still plenty of work to chase (City of Kelowna buyer profile).
How should a contractor approach British Columbia?
- Follow the capital pipeline. Nearly $38 billion over three years, with the second quarter historically the richest for major awards. Build relationships before the big contracts land in spring (BC Bid).
- Watch BC Housing's DASH RFPs. If you deliver prefab, modular or standardized housing components, BC Housing is telling you exactly what it wants. Keep capability statements ready.
- Map your services to funded programs. UBCM funding streams, such as FireSmart, development approvals and emergency operations centre grants, have real deadlines. Local governments with approved funding are motivated buyers.
- Fish where the fish are, or where nobody else is. Vancouver and Kelowna hold 74 percent of tracked municipal value, and construction and engineering hold 73 percent. If you are outside those cities or sectors, the concentration data points to smaller markets where competition is thinner and relationships matter more (how Publicus tracks this).
- Price for the PST expansion. Accounting, engineering, architectural and security services to government are now taxable. Adjust before your next bid.
About the data
Municipal figures come from contract records in four source portals covering 51 of 174 B.C. municipalities and regional bodies from 2019 to 2025, analysed by Publicus. Coverage is partial: most B.C. local governments are not in the dataset, some records carry no dollar value (the Township of Langley's 411 contracts among them), and the domain breakdown covers 6,778 of the 7,301 contracts. Every total is therefore a floor for the visible market, not a census of municipal buying. Budget figures are from the province's Budget 2026 release of February 17, 2026. This analysis first appeared in GovCon Weekly on February 24, 2026.
- british columbia
- municipal procurement
- capital projects
- market map
- govcon weekly